Updated in April 2026
What is the CNN Fear and Greed Index and What Does It Measure?
The Fear and Greed Index is a sentiment analysis tool that tracks the emotions driving market behavior. It uses a simple 0-100 scale to measure whether investors are acting out of fear or greed. The concept comes from Warren Buffett's famous advice: "Be fearful when others are greedy and be greedy when others are fearful."
The index works on a basic principle. Fear can push prices down below their real value. Greed can inflate prices beyond what assets are worth. The tool helps traders spot these emotional extremes. It gives them a snapshot of market psychology at any moment.
Both traditional stock markets and cryptocurrency markets use versions of this index. The crypto versions have become especially popular. This is because crypto markets are known for extreme emotional swings. Prices can move 20% or more in a single day based purely on sentiment.
When Did the CNN Fear and Greed Index Start?
CNNMoney created the first Fear and Greed Index in spring 2012. The timing was important. The world had just survived the 2008 financial crisis. Europe was dealing with its debt crisis. Investors needed better ways to read market sentiment.
Lex Haris and Paul R. La Monica led the project at CNNMoney. They wanted to build something beyond the existing tools like the CBOE Volatility Index (VIX). The VIX only measured expected volatility. The new index would capture the actual emotional state of the market. Their goal was to show "in an eye-blink the underlying forces driving investors' money moves."
The CNN Fear and Greed Index tracks seven key indicators. These include stock price momentum, price strength, and breadth. It also looks at put and call options, market volatility, junk bond demand, and safe-haven asset demand. Each component gives insight into different aspects of investor behavior. Together they paint a complete picture of market sentiment.
CNN Crypto Fear and Greed Index: How It Works in Crypto Markets
Cryptocurrency markets needed their own version. Crypto prices swing more wildly than traditional assets. Emotions play an even bigger role. Two companies stepped up to create crypto-specific indices.
Alternative.me launched one of the first crypto Fear and Greed indices. Their version focuses heavily on Bitcoin. It tracks Bitcoin price movements, trading volume, and social media activity. The company plans to expand the index to other major cryptocurrencies. Critics point out that this Bitcoin focus creates bias. The index might not show accurate sentiment for altcoins.
CoinMarketCap (CMC) built a more comprehensive version later. They noticed existing tools were too Bitcoin-focused. The crypto market had grown to include over 20,000 coins. CMC wanted an index that captured sentiment across the entire market. Their version uses different data sources. It looks at the top 10 cryptocurrencies, not just Bitcoin. This gives a broader view of market emotions.
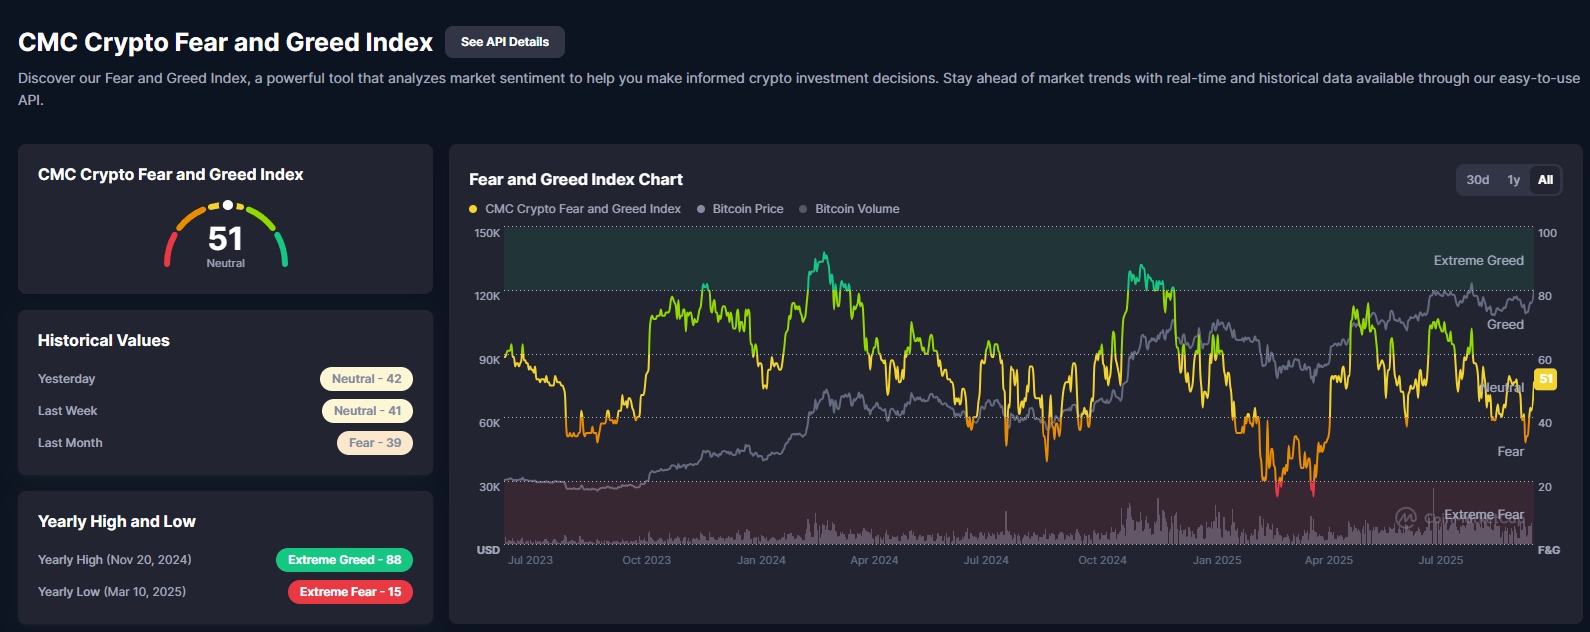
Image source: CMC
What Do Fear and Greed Index Scores Mean?
All versions of the Fear and Greed Index use the same 0-100 scale. The numbers are easy to understand. A score of 0 means extreme fear. A score of 100 means extreme greed. The middle point of 50 shows neutral sentiment.
The scale breaks down into four or five zones:
- 0-24: Extreme Fear – The market is oversold, prices may be too low
- 25-49: Fear – Caution dominates, selling pressure exists
- 50-74: Greed – Optimism is rising, buying pressure builds
- 75-100: Extreme Greed – The market may be overbought, prices could be inflated
These zones help traders quickly assess market conditions. You don't need complex charts or data analysis. One number tells you where sentiment stands. This simplicity makes the index popular with both new and experienced traders.
How Is the CNN Fear and Greed Index Calculated?
Different crypto indices use different formulas. The components they track vary significantly. Understanding these differences helps you choose which index to follow.
Alternative.me vs CoinMarketCap Fear and Greed Index
| Index | Key Components | Market Focus |
| Alternative.me | Volatility (25%), Momentum/Volume (25%), Social Media (15%), Bitcoin Dominance (10%), Google Trends (10%) | Bitcoin-centric approach |
| CoinMarketCap | Price Momentum (top 10 cryptos), Volatility (BVIV and EVIV), Derivatives Market (put-call ratio), Market Composition (SSR), Proprietary Social Data | Comprehensive crypto market |
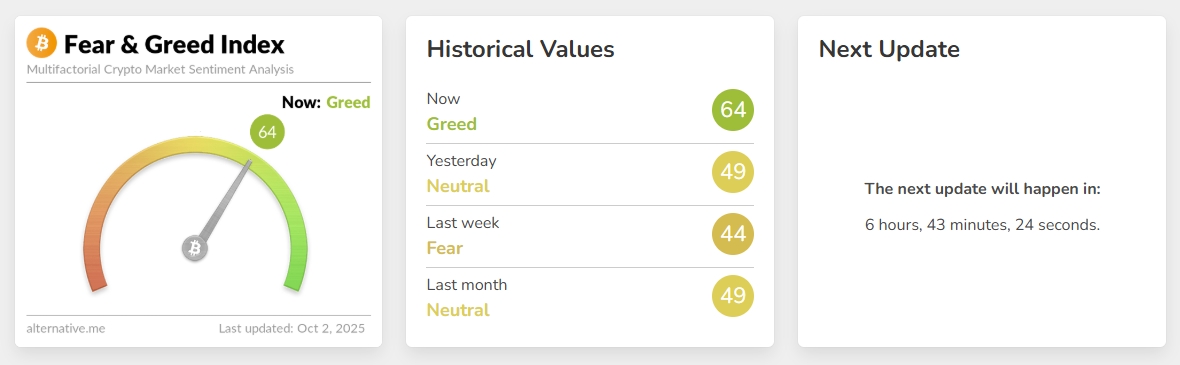
Image source: Alternative.me
The Alternative.me index puts the most weight on volatility and momentum. It measures Bitcoin price swings over 30 and 90 days. It also tracks trading volume changes. Social media gets 15% of the weight. The index monitors crypto hashtags on platforms like Twitter. Bitcoin dominance matters too. When Bitcoin's market share rises, it often means investors are fleeing altcoins out of fear.
CoinMarketCap takes a different approach. They analyze the top 10 cryptocurrencies excluding stablecoins. This gives better overall market coverage. They use Volmex Implied Volatility Indices for both Bitcoin and Ethereum. The derivatives market data shows them the put-call ratio. This reveals whether traders expect prices to go up or down. The Stablecoin Supply Ratio (SSR) compares Bitcoin's market cap to major stablecoins. When people hold stablecoins instead of Bitcoin, it signals caution.
How Traders Use the Fear and Greed Index as a Contrarian Signal
The Fear and Greed Index works best as a contrarian indicator. This means you do the opposite of what the crowd does. When everyone is fearful, you look for buying opportunities. When everyone is greedy, you consider selling.
Extreme fear often appears at market bottoms. Panic selling drives prices down too far. Assets become undervalued. Smart investors see these moments as entry points. The old trading wisdom says to "buy when there's blood in the streets." The index helps you spot these bloody moments without getting caught up in the panic.
Extreme greed appears at market tops. Euphoria takes over. Everyone thinks prices will keep rising forever. New investors rush in without understanding the risks. Experienced traders know this is when corrections happen. The index warns you when the party is getting too wild.
The key is patience. You wait for extreme readings. You don't act on every small change. A reading of 55 versus 60 doesn't matter much. But a drop from 85 to 25 signals a major shift. These extreme swings create the best trading opportunities.
CNN Fear and Greed Index Historical Data: Key Price Moments
Real-world data shows how the index tracks with actual price movements. Looking at Bitcoin's major price points reveals clear patterns.
On November 9, 2021, the index hit 84 (Extreme Greed). The next day, Bitcoin reached its all-time high of $69,044. This was a perfect example of peak greed. Everyone was buying. Media coverage was everywhere. The index correctly identified the top. One year later, on November 9, 2022, Bitcoin had crashed to $15,922. The index showed 29 (Fear). The market had completely reversed.
The index has recorded some extreme readings. Its all-time high was 95 on June 26, 2019. Its all-time low was 6 on June 19, 2022. That low reading came during a brutal bear market. Multiple crypto companies were collapsing. FTX hadn't fallen yet, but Luna and Celsius had already crashed. Investors were terrified.
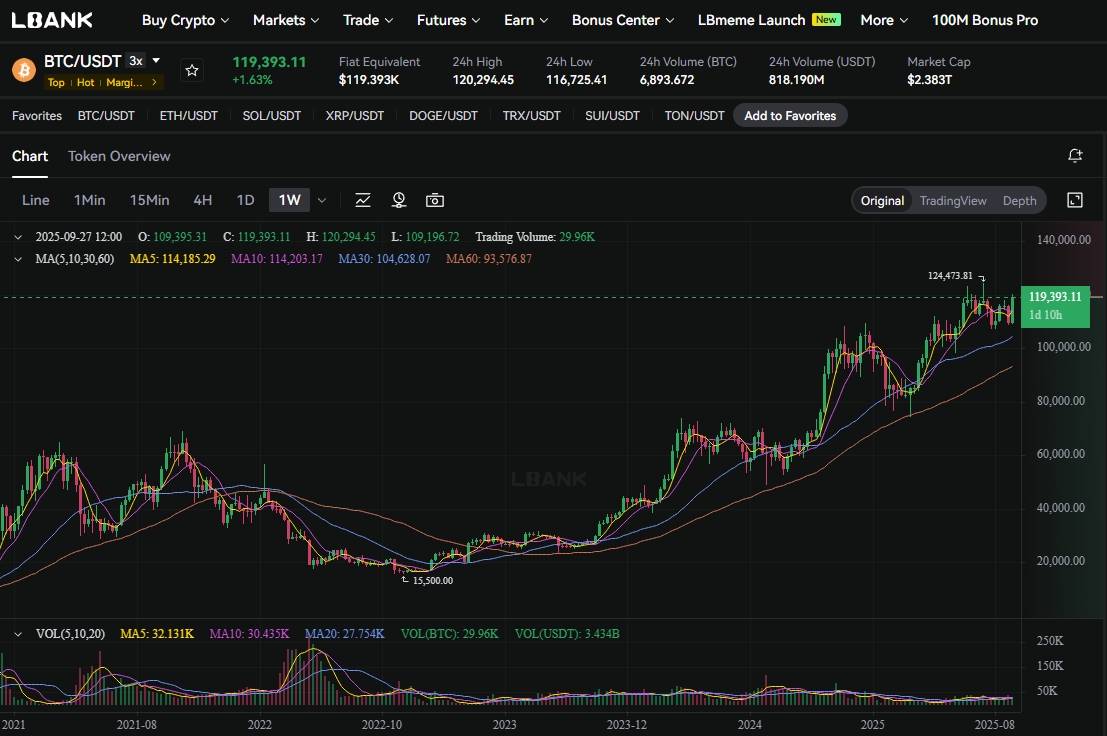
Image source: BTC Price 1W Chart, LBank
December 2024 brought another milestone. Bitcoin hit $109,000. The index read 88 (Extreme Greed). But something interesting happened a few months later. Bitcoin pushed even higher to around $124,400 in 2025. This time the index only showed 68 (Greed). The sentiment was noticeably cooler. This suggests the market had matured. Institutional investors were entering. These professional players don't get as emotional as retail traders.
How Social Media and News Affect the Fear and Greed Index
The Fear and Greed Index has become a social media phenomenon. Traders share screenshots of the index constantly. Platforms like X (formerly Twitter), Threads, and Bluesky see daily posts about the readings.
The memes come out during extreme fear. People post the index showing single digits with captions like "this is fine" over images of burning rooms. These posts are often sarcastic. They help traders cope with portfolio losses through humor. But they also spread awareness of the index to new audiences.
Recent market events have tested the index's accuracy. President Donald Trump's tariff agenda in 2025 created global market chaos. Trade war fears spread quickly. The index dropped into extreme fear territory. This matched the panic in traditional markets too. Crypto wasn't isolated from macro events anymore.
The CMC index launch marked an important development. It addressed the Bitcoin bias problem. The crypto market had diversified significantly. Ethereum, Solana, and other chains had built real ecosystems. An index that only tracked Bitcoin missed huge parts of the market. CMC's broader approach gave traders better information. They also made the data available through an API. This let developers build tools and apps using real-time sentiment data.
Fear and Greed Index Timeline From 2012 to 2025
Understanding the index's evolution helps you appreciate its current form:
This timeline shows how the tool has evolved. Each version gets more sophisticated. The data sources expand. The calculations improve. But the core concept stays the same. Fear and greed still drive markets.
Why Traders Use the Fear and Greed Index
The Fear and Greed Index offers several practical advantages. It captures qualitative data that other tools miss. Traditional technical indicators look at price and volume. They don't measure social media sentiment or Google search trends. The index fills this gap.
Volatility becomes easier to understand through sentiment. When the index shows extreme fear, you know volatility will be high. Traders can adjust their position sizes accordingly. They can use wider stop losses. They can prepare for bigger price swings. The emotional context helps them manage risk better.
The index also signals potential trend reversals. Markets rarely go straight up or down forever. Extreme readings often appear right before major turns. A reading of 95 doesn't mean prices will keep rising. It usually means the rally is running out of steam. A reading of 10 doesn't mean more crashes are coming. It often marks the bottom.
News and social media impact gets quantified. You don't need to scroll through Twitter for hours. You don't need to track hundreds of news sources. The index does this work for you. It processes massive amounts of information. It turns that information into one number.
How Accurate Is the CNN Fear and Greed Index?
No indicator is perfect. The Fear and Greed Index has clear limitations. You need to understand these before relying on it for trading decisions.
The index is a lagging indicator. It reflects what already happened. It looks at past price movements, yesterday's social media posts, and last week's trading volume. This means it can't predict the future. A high reading today doesn't guarantee what happens tomorrow. Markets can stay in extreme fear or extreme greed for long periods.
Quantifying emotions is inherently difficult. Social media sentiment analysis isn't perfect. An algorithm might miss sarcasm. It might misinterpret memes. People saying "Bitcoin is dead" might be joking. The index treats these posts as genuine fear. This creates noise in the data.
The tool lacks historical data compared to traditional indicators. The crypto versions only have a few years of track record. Traditional markets have decades of data to validate their indicators. We don't know how the crypto Fear and Greed Index performs through multiple full market cycles. It might work differently as crypto markets mature.
Bitcoin bias remains an issue with some versions. The Alternative.me index focuses heavily on Bitcoin. But Bitcoin dominance has dropped from over 70% to under 50% in recent years. An index that only tracks Bitcoin might show extreme greed while altcoins are crashing. This creates false signals for traders focused on other cryptocurrencies.
The index completely ignores fundamentals. It doesn't look at adoption rates, regulatory developments, or technological improvements. A project might have broken code and failing infrastructure. But if social media sentiment is positive, the index shows greed. You can't use sentiment alone to make investment decisions.
How to Use the Fear and Greed Index in Crypto Trading Strategy
The Fear and Greed Index works best as one tool among many. You should never trade based solely on sentiment readings. Combine it with other tools like Bitcoin Rainbow Chart, technical analysis, and fundamental research.
Start by identifying extreme readings. Wait for scores below 20 or above 80. These signal major emotional extremes. Don't chase every small movement. A shift from 45 to 55 doesn't create trading opportunities. But a drop from 75 to 15 definitely does.
Use the index to confirm your technical analysis. Say you're watching Bitcoin support at $30,000. The price bounces off this level. You check the Fear and Greed Index. It shows extreme fear at 12. This combination gives you more confidence. Technical support plus extreme fear creates a strong buy signal. Both indicators point the same direction.
Scale your positions based on sentiment. When the index shows extreme greed, reduce your position sizes. Take some profits. Let your winners run but protect your gains. When the index shows extreme fear, you can be more aggressive. Add to positions in quality projects. The risk-reward ratio improves when everyone else is panicking.
Compare different versions of the index. Check both Alternative.me and CoinMarketCap readings. If they disagree significantly, dig deeper. Figure out why the readings differ. This helps you understand what's happening in different parts of the market. Bitcoin sentiment might be very different from altcoin sentiment.
Always do your own research (DYOR). The index shows you what the crowd thinks. It doesn't tell you what's actually true. A project might have terrible fundamentals but positive sentiment. Don't buy something just because the crowd is greedy. Don't sell something just because the crowd is fearful. Use sentiment as context for your own analysis.
What the Fear and Greed Index Reveals About Crypto Market Maturity
The changing relationship between price and sentiment tells an important story. Compare the 2021 and 2025 Bitcoin all-time highs. In 2021, extreme prices came with extreme greed. The index hit 84 right before the $69,000 top. Everyone was euphoric.
In 2025, Bitcoin reached $124,400. But the index only showed 68. This represents a significant shift. The market had matured. Institutional investors brought more capital. These players don't act on emotion. They follow systematic strategies. They rebalance portfolios based on predetermined rules. Their participation dampens emotional extremes.
This maturation changes how you should interpret the index. Extreme readings might become rarer. The index might spend more time in the 40-60 range. This doesn't make it useless. It just means you need to adjust your expectations. A reading of 75 might be the new "extreme greed" in an institutionalized market.
The tool will keep evolving. New data sources will be added. Calculation methods will improve. Machine learning might help analyze sentiment more accurately. But the core human emotions won't change. Fear and greed will always drive markets. The index just helps you measure these timeless forces in modern markets.