
After failing to maintain a brief recovery, XRP is currently trading in a weak technical structure, with the price hovering around the $1.30 range, while NIGHT and Shiba Inu are extremely close to testing substantial support levels.
Shiba Inu finally looks like it is stabilizing. Recent price action indicates that the asset may be trying to rebuild a local uptrend, rather than continuing its decline unabated. The short-term setup is starting to change, but the overall structure is still bearish.
Currently trading in the $0.0000060 range, SHIB has developed a discernible rising support line in recent sessions. This structure shows that buyers are progressively entering the market at higher levels, resulting in a sequence of higher lows. In contrast to earlier attempts at recovery, this action was not rejected right away, which lends some legitimacy to the emerging trend.

Separating the macro picture from the short-term structure is crucial, though. All of the major moving averages are still declining, and SHIB is still below them. This indicates that a complete reversal has not yet been confirmed by the asset. Rather, a local uptrend is emerging within a more general bearish environment, during a transitional phase.
The $0.0000065-$0.0000067 range is where the main resistance is located. This level is consistent with short-term moving averages and has stopped several attempts to move higher. The case for a recovery would be strengthened by a breakout above this zone, which could pave the way for higher resistance close to $0.0000075.
The rising trendline currently serves as dynamic support on the downside. SHIB might keep gaining momentum and possibly take on overhead resistance once more, if this structure holds. A breakdown below this trendline, however, would negate the short-term uptrend, and probably put the asset back on its prior bearish trajectory.
The current arrangement offers investors both risk and opportunity. A more extensive recovery phase might be sparked by a successful continuation of this rising structure, but it might also bring back market volatility. Because meme assets like SHIB have a tendency to magnify market sentiment, any upward trend may soon become crowded and result in abrupt reversals.
SHIB has not yet completely reversed its trend, but it has also not entirely lost its potential for growth. Whether this emerging structure can sustain and grow will determine the next course of action.
A distinct series of lower highs, and persistent rejection from important resistance levels, characterize the overall trend, which is still bearish. A breakdown from a small ascending trendline in recent price action confirms that even local bullish attempts are failing.
With the RSI in a neutral-to-weak zone, and no obvious bullish divergence developing, momentum indicators are likewise unimpressive.
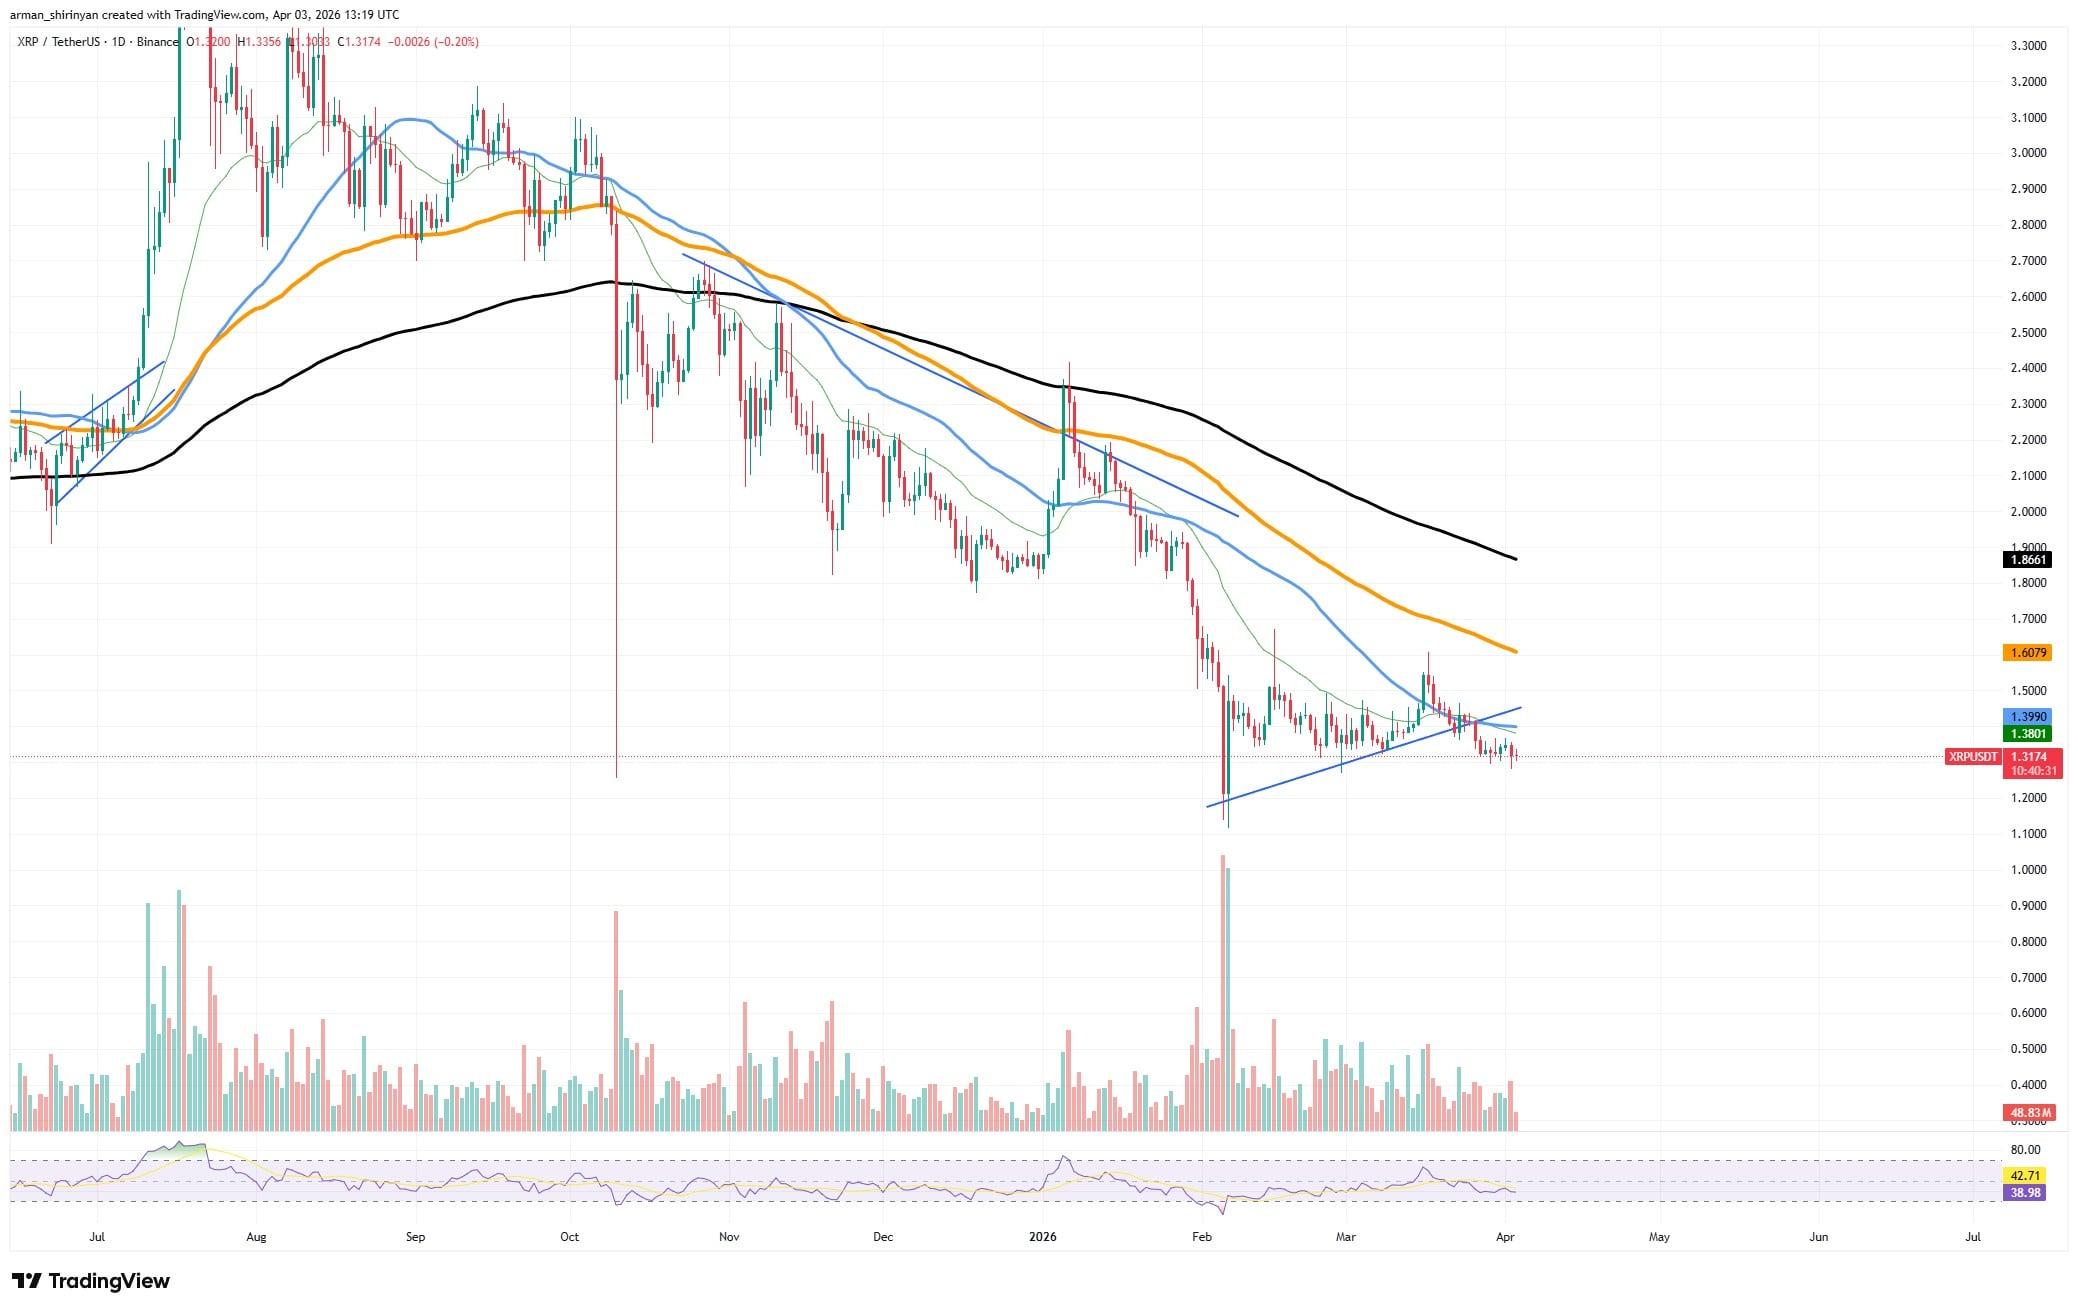
In order for XRP to enter a bullish reversal phase, three important conditions must be met. Initially, the price needs to recover and stay above the $1.38-$1.40 resistance level. This level serves as the immediate barrier and has consistently rejected upward attempts. The first sign that selling pressure is lessening would be a clear breakout and consolidation above it.
Second, XRP must create a higher high in order to break its wider descending structure. Moving toward the $1.50-$1.60 area, where there is stronger resistance and a moving average confluence, would probably be necessary to accomplish this. Any upside move would only be a brief bounce, rather than a reversal, in the absence of this structural change.

Third, there needs to be a significant increase in both volume and participation. Breakouts are unlikely to last in the absence of significant inflows, and current trading activity does not reflect accumulation. Confirmation of a bullish reversal necessitates increased volume and more active market participation.
None of these requirements are currently satisfied. Continued consolidation, or a slow decline, are more likely, particularly if the $1.25-$1.30 support zone deteriorates under repeated testing. The downtrend may continue if there is a breakdown below this level.
With the price currently at what can be regarded as the first significant support level, following a protracted downtrend, Midnight has reached a crucial technical zone that could determine its next directional move.
This area is structurally significant because the asset is testing a level where previous selling pressure slowed, and it is currently trading around $0.044. NIGHT has been creating a series of lower highs and lower lows, following a steep drop from previous highs, confirming a persistent bearish trend.
Nonetheless, the current area represents the initial point at which downward momentum begins to stabilize. Selling pressure appears to be being absorbed, at least temporarily, as the price is now consolidating in a relatively narrow range, rather than accelerating downward.
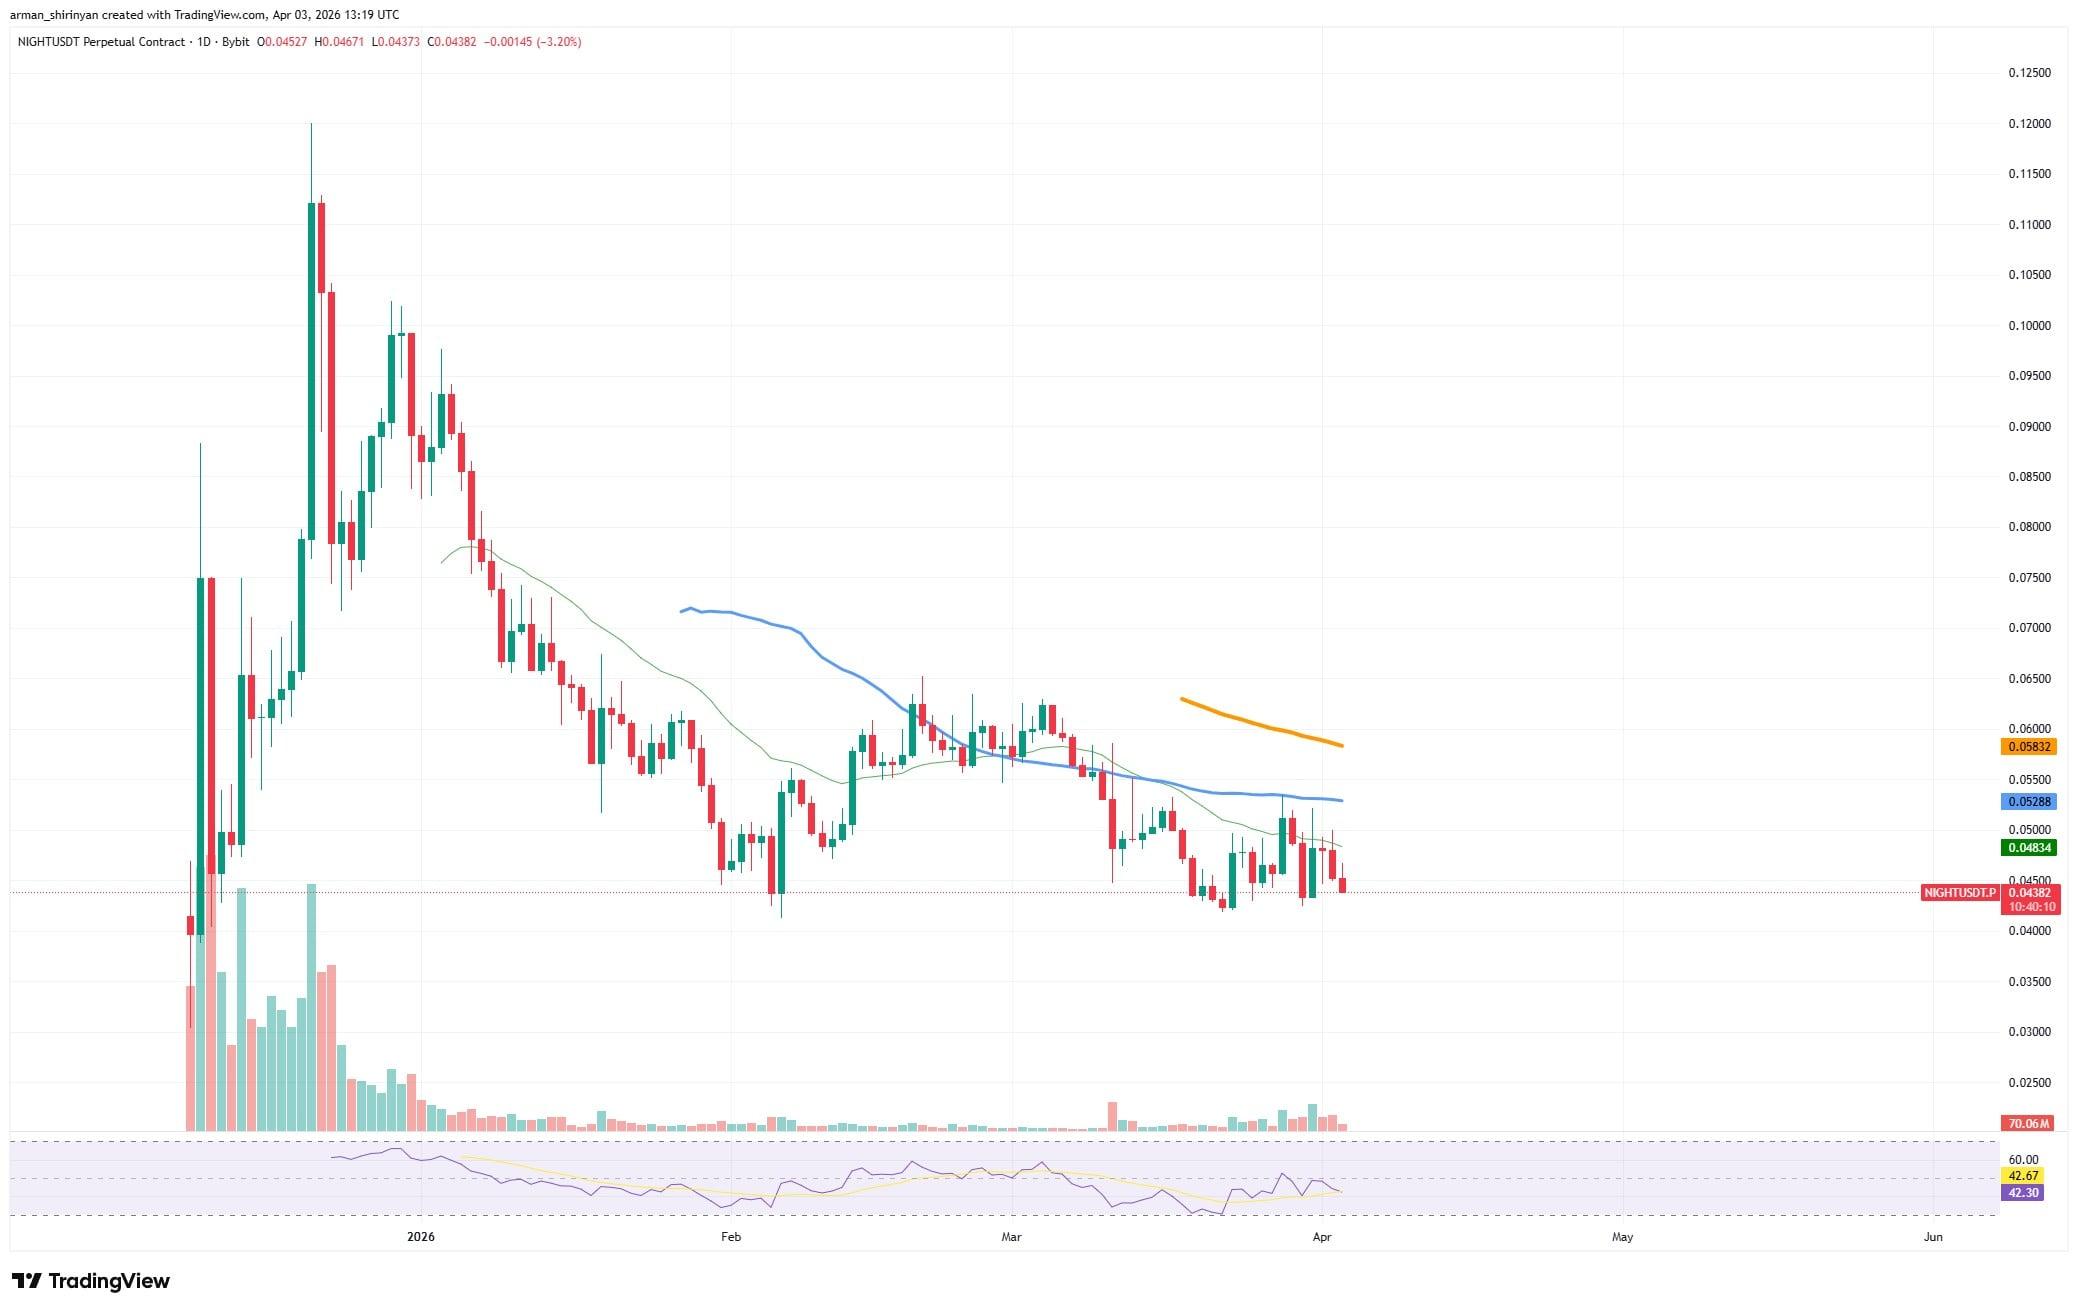
Because it corresponds with previous demand activity and represents the first level where buyers have a realistic chance to change short-term structure, this golden support zone is notable. A clean downtrend could give way to a consolidation phase, or even a brief attempt at recovery, if this level is maintained.
The $0.048-$0.052 region, which is where short-term moving averages and immediate resistance are located, would probably be the target of a bounce from here.
Nevertheless, the overall situation is still negative. All of the major moving averages, which are still trending lower, are still below NIGHT. There is no obvious indication of aggressive accumulation, and the volume is still comparatively low, in comparison to previous stages.
As a result, even though the support is technically important, it has not been verified as a reversal zone yet. Instead of viewing this level as a certain bottom, investors should view it as a decision point.