



Updated in April 2026
Bitcoin Stock-to-Flow, Rainbow Chart and Power Law: Why Pricing Models Keep Failing
Bitcoin pricing models have captivated traders and investors for over a decade. These mathematical frameworks promise to decode Bitcoin's volatile price movements and predict future values. Yet time and again, these models collapse when faced with Bitcoin's unpredictable reality.
The phrase "All your models are destroyed" has become a rallying cry in the Bitcoin community. Michael Saylor popularized this expression while explaining how unexpected events can shatter even the most sophisticated pricing models. When billionaires suddenly decide to buy Bitcoin or major exchanges collapse overnight, traditional models become useless. This pattern of model failure has repeated so often that it's become part of Bitcoin's identity.
The quest for a reliable Bitcoin pricing model reflects a deeper human need for certainty in uncertain markets. Investors want frameworks that can tell them when to buy, when to sell, and where prices are headed. But Bitcoin's history shows these models work until they don't. And when they fail, they often fail spectacularly.
Bitcoin Stock-to-Flow Model: Deviations, Criticism and Controversy
The Stock-to-Flow model was the dominant Bitcoin pricing framework of the early 2020s. PlanB, an anonymous analyst, built it by borrowing from commodity valuation, comparing Bitcoin's existing supply to the new supply entering circulation through mining. The concept was clean. Bitcoin's supply grows more slowly after each halving, so scarcity increases, so price should follow.
The predictions were anything but modest. The basic S2F model called for $100,000 multiple times between 2021 and 2023. The Cross-Asset version pushed that to $288,000 by 2024. These weren't ballpark figures either. They came with charts, formulas, and historical data that looked, at least on the surface, convincing.
For a while, it seemed to work. Prices rose after halvings, roughly in line with what the model suggested, and PlanB's follower count grew accordingly. The four-year halving cycle formed the backbone of the whole theory. Cut the new supply in half, double the stock-to-flow ratio, prices go up. Simple enough that almost anyone could understand it.
Then came the deviations. The $100,000 floor that was supposed to hold by end of 2021 never appeared. Bitcoin traded around $47,000 instead. Then it crashed to $15,500 in 2022, more than 80% below what S2F projected for that period. PlanB acknowledged the gaps but attributed them to external factors rather than model failure, which struck many critics as convenient.
By 2025 and into 2026, the numbers had become almost surreal. The S2F average price projection for this period had risen to around $500,000. Bitcoin peaked at $126,000 in October 2025 and then corrected to the $65,000 to $75,000 range in early 2026. A model predicting $500,000 while the asset trades at $70,000 is no longer really a model. It's a wishlist.
The deeper criticism was always statistical. The model is auto-correlative, meaning the prediction line is shaped by the same historical prices it claims to be predicting. Both variables trend upward together over time, which creates the appearance of correlation without proving causation. Most serious analysts have quietly moved on and now treat S2F as a historical artifact rather than a live forecasting tool.
Bitcoin Rainbow Chart: How It Survived and Where It Stands Currently
The Rainbow Chart shouldn't have survived. It started as a meme, got broken by market conditions in 2022, and had to be rebuilt from scratch. Yet here it is today, still being used and still broadly relevant. That says something.
The origin story helps explain why. In 2014, a BitcoinTalk user called "Trolololo" posted a logarithmic regression model during one of Bitcoin's early bear markets. A Reddit user named "azop" took that framework and threw rainbow colors on it with joke labels. "Fire Sale" at the bottom. "Maximum Bubble Territory" at the top. It was designed to be funny as much as useful, and that self-awareness turned out to be its greatest strength.
Rohmeo at BlockchainCenter.net brought it into the modern era in 2019, turning it into a proper interactive tool. Eric Wall helped send it viral in 2020. By that point it had moved from forum curiosity to something people actually referenced when making investment decisions, which probably wasn't the original intention.
The crisis came in late 2022. Bitcoin fell below the lowest band for the first time in nearly a decade, which technically broke the model. But rather than defending a broken framework, Rohmeo simply updated it. Version 2 launched in November 2022 with recalibrated formulas, followed by another adjustment in 2023 to reflect a maturing market with lower volatility than earlier cycles.
That willingness to adapt is precisely what the S2F model lacked. Where PlanB defended his projections in the face of mounting evidence, the Rainbow Chart just changed. You can debate whether that makes it more honest or less rigorous. Probably both.
At the time of writing, the chart is in the green "BUY" to "Accumulate" bands following the correction from Bitcoin's October 2025 all-time high of $126,000. For context, that ATH touched the upper orange bands without ever breaching dark red "Maximum Bubble Territory," which V2's recalibration made harder to reach than the original model. The April 2026 band levels sit roughly as follows: Fire Sale around $56,000, BUY around $75,000, Accumulate around $97,000, Still Cheap around $126,000. Current price puts Bitcoin in early accumulation territory by the chart's logic.
How to Read and Use the Bitcoin Rainbow Chart
Understanding the Rainbow Chart requires grasping both its technical structure and practical limitations. The chart displays Bitcoin's price on a logarithmic scale, which means each vertical increment represents a multiplication rather than addition. This logarithmic view makes long-term trends clearer by preventing recent price movements from overwhelming historical data.
The rainbow bands themselves follow a mathematical formula based on regression analysis of historical prices. Each color band represents a different deviation from the logarithmic growth trend. The bands get their names from market sentiment rather than mathematical properties. Dark blue sits at the bottom, followed by light blue, green, yellow, orange, light red, and dark red at the top.
For a detailed breakdown of how the log bands work, see the Bitcoin Rainbow Chart guide.
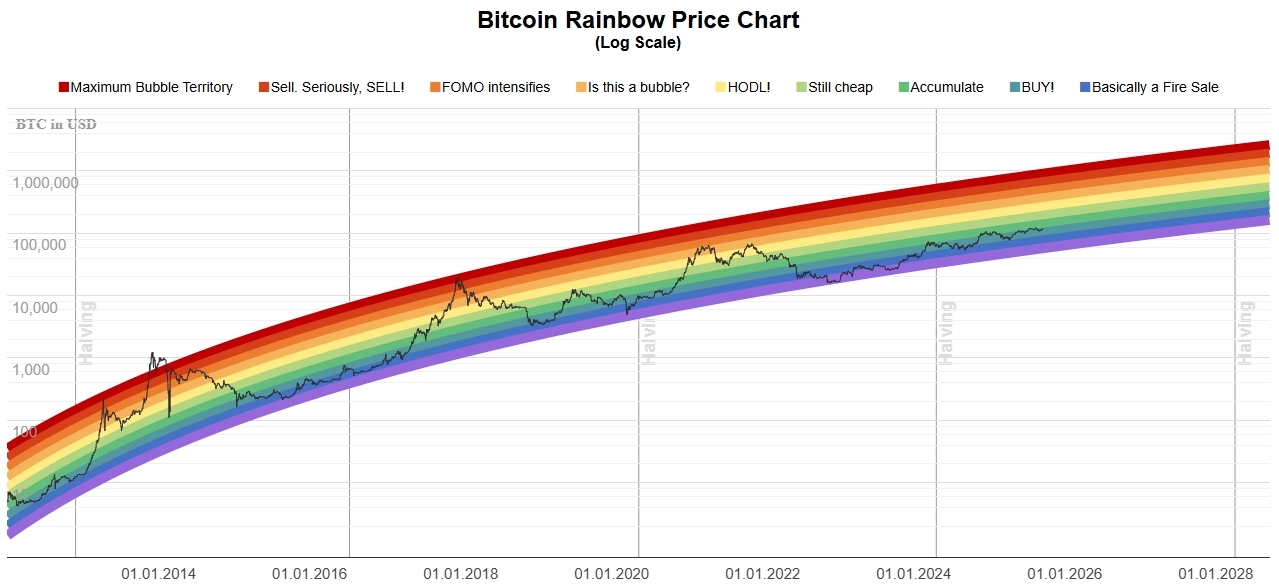
Bitcoin Price Rainbow Chart (Image From Blockchaincenter)
Understanding Each Rainbow Band
| Band | Label (from chart) | Meaning/Interpretation |
| Dark Blue | Basically a Fire Sale | Extreme undervaluation zone. Historically appears near cycle bottoms. Long periods possible during bear markets. |
| Blue | BUY! | Strong accumulation opportunity. Historically profitable over multi-year horizons, though short-term volatility remains. |
| Green | Accumulate | Lower-middle valuation. Often used by long-term investors to steadily add positions in both bull and bear markets. |
| Light Green | Still cheap | Suggests undervaluation compared to long-term trend. Market often consolidates here before moving upward. |
| Yellow | HODL! (hold on for dear life) | Neutral zone. Neither strong buy nor sell pressure; represents consolidation and sideways market behavior. |
| Orange | Is this a bubble? | Indicates speculative activity is building. Media and retail attention usually intensify here. |
| Light Red | FOMO intensifies | Demand is often driven by hype and fear of missing out. Short-term gains possible but risk increases. |
| Red | Sell. Seriously, SELL! | Signals major overvaluation relative to historical trend. Profit-taking here has often preceded corrections. |
| Dark Red | Maximum Bubble Territory | Extreme speculative peaks. Historically reached only at major cycle tops before sharp downturns. |
Practical Application Strategies
The chart works best as a macro lens, not a trading signal. Most experienced users combine it with on-chain data like MVRV or SOPR rather than acting on band position alone. When multiple indicators align with the Rainbow Chart's reading, conviction is higher. When they diverge, it usually pays to be cautious.
Time horizon is everything here. The bands can look wildly different month to month. Someone using this for short-term trades will find it frustrating. For investors thinking in years, it offers a useful sanity check on whether they're buying near historical extremes.
Dollar-cost averaging pairs naturally with the Rainbow Chart. Increasing purchases in blue bands, pulling back in orange and red, is a systematic approach that takes emotion out of the equation. It doesn't require you to time anything perfectly.
The chart helps manage psychological biases. During euphoric bull markets, the red bands remind investors that extremes don't last. During depressing bear markets, blue bands suggest the worst may be near. This psychological anchoring proves valuable even if specific predictions fail.
Common Mistakes to Avoid
Treating the chart as a schedule is probably the most common mistake. Bitcoin can sit in one band for months or jump several bands in weeks. The colors indicate tendencies, not timelines.
Rigidity is the other one. Investors who refuse to buy above dark blue or sell below dark red end up missing most of the market. The chart is context, not a rulebook.
And always check which version you're looking at. The November 2022 recalibration shifted all the bands significantly. Old screenshots floating around online will give you completely wrong readings.
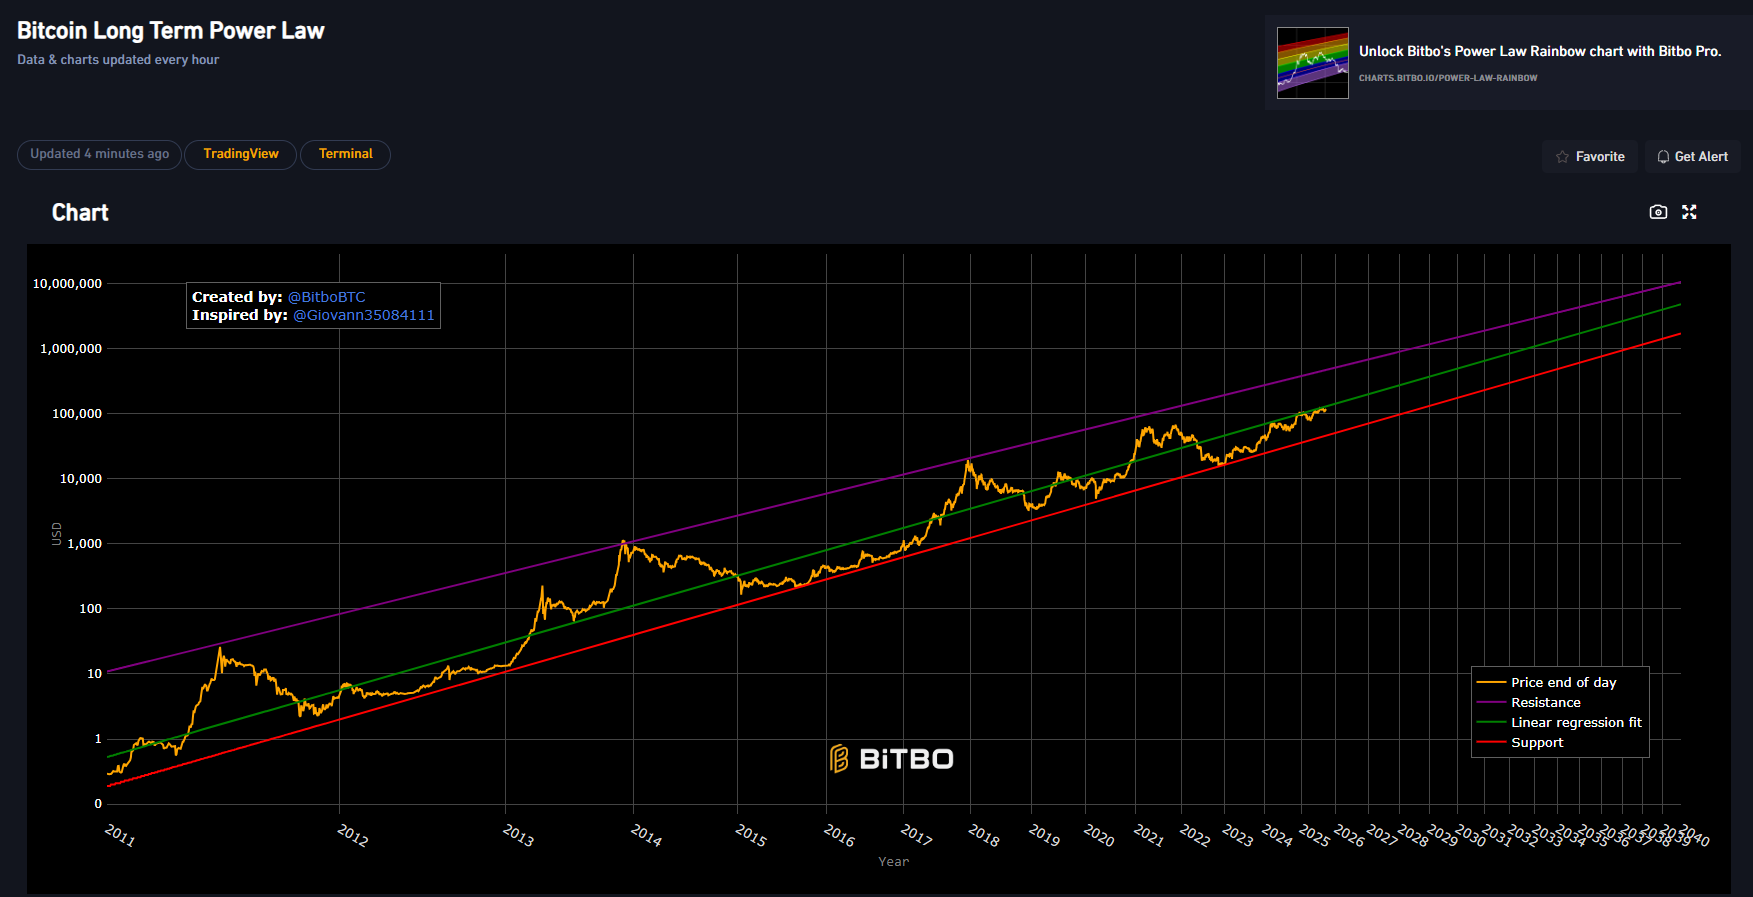
Bitcoin (BTC) Long Term Power Law Chart (Created by: @BitboBTC, Inspired by: @Glovann35084111)
Bitcoin Halving and the Rainbow Chart: How Each Cycle Shifts the Bands
Across the 2012, 2016, and 2020 halvings, the pattern was consistent. Bitcoin sat in the lower blue and green bands around the halving date, then climbed into yellow and orange over the following 12 to 18 months. It wasn't perfect every cycle but it was close enough that people built strategies around it.
The 2024 halving was different. Bitcoin entered the event already above $60,000, sitting in yellow territory rather than the classic accumulation zone. The market had priced in the halving well in advance, which reflects how much more institutional and anticipatory the participant base has become. You don't get the same slow build from the bottom when hedge funds and ETF buyers are already positioned.
Post-halving, Bitcoin still reached a new all-time high of $126,000 in October 2025, touching upper orange bands without breaching dark red. The 2026 correction pulled it back into green accumulation territory, which mirrors the mid-cycle dip pattern seen in previous cycles, though it's worth being careful about reading too much into a sample size of four halvings.
The April 2028 halving will drop the block reward to 1.5625 BTC. The Rainbow Chart's band levels for that period will sit meaningfully higher given the model's logarithmic growth assumption, though whether Bitcoin will actually trade anywhere near those levels depends on factors no chart can predict.
Bitcoin Power Law and Rainbow Chart: Is the Model Still Valid Now?
Giovanni Santostasi's Power Law model took a different approach to everything that came before it. Rather than tying price to supply metrics like S2F, he plotted the logarithm of Bitcoin's price against the logarithm of time. The resulting line was surprisingly straight, suggesting Bitcoin's growth follows a consistent mathematical pattern across its entire history.
The physics background helped with credibility. Power laws show up throughout nature, in earthquake magnitudes, city sizes, metabolic rates. Applying that framework to Bitcoin gave the model a scientific legitimacy that S2F's commodity comparisons lacked. And unlike S2F, the Power Law offered a range rather than specific price targets, which made it harder to definitively disprove.
Santostasi's original projection placed Bitcoin at approximately $210,000 by January 2026. The actual price was somewhere between $90,000 and $96,000, well below the model's projected fair value of $136,000 to $142,000. That's a significant miss. Critics pointed to everything the time-based model ignores: Fed rate decisions, the surprisingly flat 2025 that defied supercycle expectations, the $8 billion in ETF outflows that hammered price in early 2026.
Yet the Power Law hasn't technically broken. Its support floor sits near $45,000 to $48,000 and Bitcoin has stayed above it. Some analysts describe it as the last long-term model still standing, though they tend to use it for risk management floors now rather than price targets. The controversy deepened when Santostasi applied similar power law analysis to smaller altcoins, which alienated much of his Bitcoin-focused audience. If the same pattern fits random altcoins, what does it actually tell you about Bitcoin specifically?
Where the model goes from here depends largely on whether Bitcoin can close the gap with its projected fair value over the next 12 to 18 months. If it does, the Power Law gets rehabilitated. If it doesn't, it joins S2F in the graveyard of models that looked unbreakable until they weren't.
Timeline of Major Model Failures
The history of Bitcoin pricing models is a cycle of attempts, breakthroughs, and partial failures.
Key Figures Behind Bitcoin Models
Several personalities shaped the rise and fall of Bitcoin pricing models. Their stories reveal how hope, hubris, and humor intersect in cryptocurrency markets.
Michael Saylor is less a model builder than a model critic. His phrase "All your models are destroyed" has aged better than most of the models it was aimed at. His point has always been that Bitcoin is a human phenomenon and human decisions, the unpredictable ones, will always override mathematical frameworks.
PlanB built the most followed Bitcoin model of its era and watched it slowly come apart. The S2F predictions that attracted millions of followers are now a source of ongoing embarrassment, with the model projecting prices that bear no resemblance to where Bitcoin actually trades. His anonymity has at least spared him the full personal cost of that.
Giovanni Santostasi brought genuine academic rigor to the space. His Power Law was more carefully constructed than most. But the $210,000 January 2026 target falling short by more than half, and the decision to apply the same logic to altcoins, cost him significant credibility with the audience he had built.
Rohmeo is arguably the most pragmatic figure in this story. He built something, watched it break, fixed it, and moved on without making it a bigger deal than it needed to be. The Rainbow Chart is still alive largely because of that approach.
Matt Crosby from Bitcoin Magazine Pro represents where serious analysis has moved. Real-time on-chain data, multi-model frameworks, and a healthy skepticism toward anything that promises too much certainty.
Comparing Different Model Philosophies
The S2F and Rainbow Chart represent opposite philosophies in Bitcoin analysis:

The S2F and Rainbow Chart represent genuinely opposite bets about what drives Bitcoin's price.
S2F says it's supply. Scarcity is the variable that matters, halvings are the catalyst, and if you model those correctly you can predict price. It's a clean theory that worked well enough for a few cycles to seem credible. The problem is that demand, regulation, macro conditions, and human behavior don't appear anywhere in the formula.
The Rainbow Chart doesn't pretend to explain why Bitcoin moves. It just maps where price sits relative to its historical trajectory and attaches sentiment labels to help people think about whether they're buying in fear or euphoria. It's less a model than a mirror. That's also why it has outlasted everything else, you can't really disprove a mirror.
The S2F model bet on mathematical elegance and paid the price when reality diverged. The Rainbow Chart bet on humility and adaptability, and that turned out to be the more durable strategy.
Modern Approaches to Bitcoin Analysis
The collapse of traditional models has pushed serious analysts toward a more dynamic toolkit. Nobody worth listening to is relying on a single framework anymore.
On-chain metrics have become central. The MVRV Z-Score measures whether Bitcoin is overvalued or undervalued relative to its realized value, updating constantly from actual blockchain data. The SOPR tracks whether holders are selling at a profit or a loss, which tells you a lot about where sentiment actually sits versus where people say it sits.
ETF flow data has become impossible to ignore. In early 2026, U.S. spot Bitcoin ETFs saw nearly $8 billion in outflows over five weeks, driving price down in ways no Rainbow Chart band or S2F ratio had any mechanism to predict. When flows reversed in March 2026 with $1.32 billion in net inflows, price stabilized almost immediately. That cause-and-effect relationship is now as important as anything on a logarithmic chart.
Macro conditions matter more than the old models assumed. Fed rate decisions, global liquidity cycles, and institutional positioning all move Bitcoin now in ways that simply weren't visible when S2F was built. A model that ignores all of that is working with maybe half the relevant information.
What Failed Models Teach About Bitcoin
The pattern across every failed model is the same. They fit historical data, build a following, get tested by an event they weren't designed to handle, and break. S2F's version of this was gradual and then sudden. The Power Law is still playing out. The Rainbow Chart sidestepped it by changing the rules rather than defending them.
What that actually tells you about Bitcoin is that it's a moving target. The market structure in 2026 looks nothing like 2019. Institutional ETFs, macro sensitivity, and a much larger and more sophisticated participant base have changed the dynamics in ways that models built on earlier data can't fully capture.
The honest use of any of these tools is as one input among many. They're useful for broad orientation, for checking whether you're buying near historical extremes, for managing the psychological pull of FOMO and panic. They're not useful for telling you what Bitcoin will be worth in six months, and never were.
The Future of Bitcoin Price Discovery
Price discovery is getting more efficient and more complicated at the same time. A more sophisticated participant base means old patterns get arbitraged away faster. What worked as a signal in 2019 may be noise by 2026.
Real-time data has mostly replaced static models at the serious end of the market. ETF flows, funding rates, options positioning, and on-chain behavior give a much more current picture than any regression line fitted to historical prices. That doesn't make the old models useless, but it does change their role from predictive to contextual.
The most durable lesson from this whole history is probably Saylor's: all your models are destroyed. Not because the models are necessarily wrong about the past, but because the future has a way of introducing variables that weren't in the dataset. Bitcoin has done that repeatedly and will keep doing it.