Author: LBank Research Analyst: Ludo
Disclaimer: This report is compiled and analyzed from publicly available information and is intended solely for information sharing and research discussion. It does not constitute investment advice, a securities recommendation, a trading instruction, or any guarantee of returns. The company operations, valuations, market prices, and consensus expectations discussed herein may change over time. Readers should independently verify the data and make their own decisions.
1. Core Conclusion
Overall judgment: Home Depot remains the highest-quality scaled operator in U.S. home improvement, and its fiscal second-quarter result confirms that small-project and professional demand can offset a frozen housing market; however, at $344.30 and roughly 23 times the midpoint of fiscal 2026 adjusted EPS guidance, the shares look fairly valued with a mildly negative near-term risk-reward unless comparable sales accelerate beyond 2%.
-
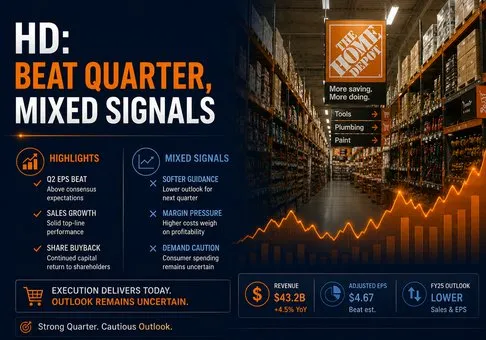
The operating result was better than the housing backdrop and better than market expectations. Fiscal Q2 2026 sales rose 5.7% to $$47.86 billion, comparable sales increased 1.7%, and U.S. comparable sales increased 1.3%. Adjusted diluted EPS of$$4.92 exceeded the $$4.73 secondary consensus cited immediately after the release, while revenue exceeded the cited$$47.24 billion consensus. The implication is that Home Depot is taking enough share and generating enough acquisition-supported growth to avoid an earnings recession, even while large remodeling demand remains constrained.
-
The quality of the comparable-sales improvement is encouraging but not yet a full-cycle recovery. Average ticket increased 2.8% to $92.50, while comparable transactions declined 1.0%. This mix indicates that price, product mix, and smaller projects did more work than customer traffic. A durable reacceleration requires transaction growth to turn positive and big-ticket projects to recover; without that, comparable sales near 1% to 2% are more likely than a return to the mid-single-digit growth rates seen during housing booms.
-
Cash conversion improved materially, but headline sales growth overstates the underlying profit acceleration. First-half operating cash flow rose 27.4% to $$11.42 billion and simplified free cash flow rose 33.9% to$$9.70 billion. Yet first-half operating income increased only 1.1%, and Q2 operating margin declined about 19 basis points to 14.29% as selling, general and administrative expense increased 8.5%. Home Depot is financially strong, but acquisition integration and expense growth must slow before the current sales growth converts into clean operating leverage.
-
The valuation already discounts a meaningful housing normalization. The August 19 close of $$344.30 implies approximately 23.0 times the$$14.99 midpoint of fiscal 2026 adjusted EPS guidance and an equity value near $$343 billion using 996 million Q2 diluted shares. A bear case of$$14.70 adjusted EPS at 20 times implies $$294; a base case of$$15.00 at 23.5 times implies $$352.50; and a bull case of$$15.30 at 26 times implies $397.80. The base case offers only about 2% price upside from the reference price, while the bear case carries roughly 15% downside.
-
Home Depot is winning relative to direct and adjacent peers, but the thesis reverses if traffic and margins fail together. Home Depot's 1.7% comparable-sales growth exceeded Lowe's 0.2%, Floor & Decor's negative 2.1%, and Tractor Supply's negative 1.5% in their latest quarters. The key falsification condition is two consecutive quarters with comparable transactions below negative 1% while adjusted operating margin falls below the 12.8% low end of annual guidance. That combination would show that ticket growth and acquisitions are masking share or demand weakness, warranting a lower earnings multiple.
The central transmission mechanism is straightforward and testable. If comparable transactions improve by roughly 100 basis points while average ticket holds near 2% growth, comparable sales can move from 1.7% toward approximately 2.7%. Applied to a roughly $$165 billion annual revenue base, that incremental point of comparable growth represents about$$1.65 billion of revenue. At a 13% adjusted operating margin, it can contribute about $$215 million of adjusted operating income, or roughly$$0.16 per share after a 24.3% tax rate and 996 million shares. At 23.5 times earnings, that operational improvement is worth about $3.75 per share before any change in the valuation multiple. This math also shows why the present valuation needs more than modest ticket-led growth to deliver a large re-rating.
2. Company Overview, Business Mix, and Core Operating Metrics
Home Depot is the world's largest home-improvement retailer by disclosed sales. Its economic engine combines a dense store network, broad product assortment, local fulfillment, contractor relationships, and digital ordering. Customers range from do-it-yourself households buying paint or garden supplies to professional contractors purchasing building materials, plumbing, electrical products, tools, and job-site delivery. Revenue is primarily recognized at the point of sale, while installation and service activities add project-based revenue. The model is not subscription-based, but repeat professional purchasing and the high urgency of repair work produce recurring demand characteristics.
The retail-store network remains the core asset. Home Depot operated 2,364 stores at Q2 end, with locations in the United States, Canada, and Mexico. Stores function as showrooms, inventory nodes, pickup points, and last-mile fulfillment centers. That physical density matters in urgent repair situations where product availability and speed are more important than the lowest online price. It also supports same-day and express delivery, creating a practical defense against general e-commerce platforms.
The professional customer is the most important strategic growth vector. Professional contractors tend to buy more frequently, place larger orders, require credit and delivery, and value job-lot availability. Home Depot expanded this capability through SRS Distribution and subsequent specialty-trade acquisitions. The company now operates more than 1,340 SRS locations in addition to the store base. This gives Home Depot access to roofing, landscaping, pool, and other complex professional categories that are not fully served by the traditional big-box format.
Home Depot does not report conventional revenue segments for retail, online, and SRS in the Q2 earnings release, so the following structure uses verifiable operating channels rather than fabricated segment revenue. The absence of a formal revenue split is itself important: acquisition-supported total growth cannot be treated as organic comparable growth.
|
Operating channel
|
Products, customers, and monetization
|
Latest disclosed scale
|
Key operating indicator
|
Strategic role
|
Research judgment
|
|
Big-box retail
|
Home improvement products sold to DIY and professional customers through stores and connected digital channels
|
2,364 stores
|
Q2 comparable sales +1.7%; U.S. +1.3%
|
Core inventory, fulfillment, and customer-acquisition network
|
Strong moat, but traffic is still negative
|
|
Professional ecosystem
|
Roofing, building products, pools, landscaping, delivery, and trade-specific services
|
More than 1,340 SRS locations
|
Total sales include acquisitions; no separate quarterly revenue disclosed
|
Extends wallet share with complex Pros and specialty trades
|
Best structural growth asset, with integration risk
|
|
Digital and fulfillment
|
Online ordering, pickup, delivery, and store-assisted fulfillment
|
Embedded across the store network
|
Separate Q2 digital growth not disclosed in the release
|
Converts physical density into speed and convenience
|
Supports share gain rather than a stand-alone profit pool
|
|
Installation and services
|
Project-related services for household and professional customers
|
Included in consolidated sales
|
Separate margin not disclosed
|
Increases ticket and customer retention
|
Attractive demand capture, but labor-sensitive
|
|
Consolidated company
|
Retail, distribution, and services
|
$47.86 billion Q2 sales
|
443.2 million transactions; $92.50 average ticket
|
Scaled home-improvement platform
|
Industry leader with incomplete organic recovery
|
The most valuable asset is the combination of store density and professional distribution. A pure online competitor can match catalog breadth but cannot easily replicate thousands of nearby inventory points and specialty branches. The most important weakness is that this asset base carries high fixed and semi-fixed costs. When transaction growth is negative, wages, delivery capacity, technology investment, and acquired infrastructure can cause selling expense to grow faster than revenue.
Core Operating Metrics and Changes
The research trigger is Home Depot's August 18, 2026 earnings release furnished with a Form 8-K. The company had not filed its fiscal Q2 Form 10-Q as of this report date, so the latest-quarter analysis uses the official earnings exhibit and balance sheets, with the fiscal Q1 Form 10-Q and fiscal 2025 Form 10-K providing fuller accounting context.
|
Metric or event
|
Fiscal Q2 2026
|
Comparison
|
Accounting or statistical basis
|
Investment meaning
|
|
Sales
|
$47.861 billion
|
+5.7% year over year
|
GAAP company disclosure
|
Healthy total growth, partly supported by acquired operations
|
|
Comparable sales
|
+1.7%; U.S. +1.3%
|
Q2 2025: +1.0%; U.S. +1.4%
|
Company comparable-sales definition
|
Better consolidated trend, but U.S. growth did not accelerate
|
|
Transactions and ticket
|
443.2 million; $92.50
|
Transactions -0.8% reported and comparable transactions -1.0%; ticket +2.8%
|
Excludes HD Supply and SRS from transaction and ticket metrics
|
Ticket is compensating for weak traffic
|
|
Profitability
|
$6.839 billion operating income; 14.29% margin
|
Income +4.3%; margin about 19 basis points lower
|
GAAP; margin calculated as operating income divided by sales
|
No clean operating leverage yet
|
|
EPS
|
$$4.79 GAAP;$$4.92 adjusted
|
+4.6% and +5.1%, respectively
|
Adjusted EPS excludes acquired-intangible amortization and related tax effects
|
Earnings grew, but adjustments are acquisition-related and recurring for now
|
|
First-half cash generation
|
$$11.422 billion operating cash flow;$$9.698 billion simplified free cash flow
|
+27.4% and +33.9%, respectively
|
Free cash flow equals operating cash flow less $1.724 billion capital expenditure
|
Strong conversion, helped by favorable working capital
|
|
Market reaction and valuation
|
$344.30 August 19 close
|
+2.0% versus August 18 close of $337.49
|
Yahoo Finance historical close; not an LBank contract price
|
Relief response, but annual adjusted earnings multiple remains about 23 times
|
The quarter beat the available secondary consensus on revenue, adjusted EPS, and comparable sales. More importantly, it improved on Q1, when sales increased 4.8%, comparable sales rose only 0.6%, U.S. comparable sales rose 0.4%, and adjusted EPS declined to $$3.43 from$$3.56. The sequential change supports the view that seasonal categories and smaller projects are stabilizing demand.
Management nevertheless reaffirmed rather than raised the fiscal 2026 outlook: total sales growth of 2.5% to 4.5%, comparable sales from flat to positive 2%, adjusted operating margin of 12.8% to 13.0%, and adjusted EPS growth of flat to 4% from $$14.69. The implied adjusted EPS range is approximately$$14.69 to $15.28. Reaffirmation after a quarterly beat is prudent because the outlook includes benefits from IEEPA tariff refunds, partially offset by fuel, energy, and other input costs. It also signals that one good seasonal quarter is not enough to declare a large-project recovery.
3. Fundamental Quality
Home Depot's fundamental quality is high because it combines strong cash production, durable category leadership, and a useful physical network. The caveat is that recent sales expansion has been more acquisition-heavy than margin-accretive, while debt remains substantial.
|
Financial item
|
Fiscal 2024
|
Fiscal 2025
|
First half 2025
|
First half 2026
|
Research judgment
|
|
Revenue
|
$159.514 billion
|
$164.683 billion
|
$85.133 billion
|
$89.626 billion
|
Annual and first-half growth, but total growth exceeds organic comparable growth
|
|
GAAP operating income / margin
|
$21.526 billion / 13.50%
|
$20.890 billion / 12.68%
|
$11.688 billion / 13.73%
|
$11.820 billion / 13.19%
|
Profit increased 1.1% in the first half while margin compressed
|
|
GAAP net income
|
$14.806 billion
|
$14.156 billion
|
$7.984 billion
|
$8.055 billion
|
Earnings stabilized but remain below fiscal 2024
|
|
Operating cash flow
|
$19.810 billion
|
$16.325 billion
|
$8.968 billion
|
$11.422 billion
|
Strong first-half rebound; working capital added $$570 million versus using$$1.821 billion
|
|
Simplified free cash flow
|
$16.325 billion
|
$12.646 billion
|
$7.245 billion
|
$9.698 billion
|
Excellent cash conversion, though working-capital timing is not permanent
|
|
Capital expenditure
|
$3.485 billion
|
$3.679 billion
|
$1.723 billion
|
$1.724 billion
|
Flat first-half spending despite a larger network
|
|
Cash / debt
|
$1.659 billion cash at fiscal 2024 end
|
$1.389 billion cash at fiscal 2025 end
|
$$2.804 billion cash;$$52.317 billion short- and long-term debt
|
$$2.085 billion cash;$$52.896 billion short- and long-term debt
|
Liquidity is adequate, but leverage limits valuation flexibility
|
Simplified free cash flow equals operating cash flow less capital expenditures. Debt includes short-term debt, current installments of long-term debt, and long-term debt excluding current installments. Fiscal labels follow Home Depot's reporting convention.
Growth and margin quality. Fiscal 2025 revenue increased 3.2%, but operating income declined 3.0%. In the first half of fiscal 2026, revenue increased 5.3% while operating income increased only 1.1%. That gap reflects acquisition amortization, integration costs, and selling-expense growth. Q2 gross margin improved about 26 basis points to 33.67%, but operating margin declined because operating expenses increased 8.2%. The business is growing; the current question is whether the larger professional ecosystem can produce cost leverage after integration.
Cash flow and capital expenditure. First-half free cash flow of $$9.70 billion exceeded net income of$$8.06 billion. The 120% conversion is strong, but the comparison benefited from a $$570 million working-capital source versus a$$1.82 billion use in the prior-year period. A normalized view should not annualize the full improvement. Still, capital expenditure was almost unchanged at $1.72 billion, showing that the company did not need a proportional spending increase to support higher revenue.
Balance sheet and capital allocation. Cash dividends were $$4.64 billion in the first half, absorbing about 48% of simplified free cash flow. Long-term debt excluding current installments declined to$$43.95 billion from $$46.34 billion at fiscal year-end, but short-term debt and current maturities kept total debt near$$52.90 billion. Goodwill and intangible assets rose to $33.38 billion, or about 31% of assets, following acquisitions. This structure is manageable for a stable retailer, but it makes successful professional-market integration essential and reduces the case for a premium multiple based solely on balance-sheet optionality.
Fundamental conclusion. The company is fundamentally strong, but the single most important variable is comparable transaction growth. Positive traffic would turn ticket gains and acquired distribution capacity into operating leverage. Persistently negative traffic would force price, mix, and acquisitions to carry growth while costs and leverage remain elevated.
4. Industry and Competitive Landscape
The relevant industry includes home-improvement retail, building-product distribution, specialty flooring, rural-lifestyle retail, and online substitutes. Demand comes from repair and maintenance, remodeling, housing turnover, household formation, weather, and professional construction activity. Repair is relatively defensive; large discretionary remodeling is highly exposed to financing costs and housing turnover. Because competitors disclose different comparable-sales definitions and product mixes, revenue and store counts are better measures of scale than a fabricated market-share percentage.
|
Competitive dimension
|
Home Depot's verifiable position
|
Scale measure and limitation
|
Main competitors or substitutes
|
Growth, margin, and valuation implication
|
|
Customer demand
|
Serves DIY and professional customers across repair, maintenance, and projects
|
443.2 million Q2 transactions excludes HD Supply and SRS
|
Lowe's, local dealers, Amazon, Walmart
|
Broad exposure stabilizes revenue, but housing turnover still governs big-ticket upside
|
|
Product and service breadth
|
Big-box assortment plus specialty trade distribution
|
Store and SRS counts do not equal revenue share
|
Lowe's and specialist distributors
|
Broader Pro capability supports wallet-share gains
|
|
Fulfillment
|
Stores act as local inventory and delivery nodes
|
2,364 stores; service levels vary by market
|
Lowe's stores, general e-commerce, local supply houses
|
Density supports urgency and delivery advantage
|
|
Professional ecosystem
|
More than 1,340 SRS locations alongside retail stores
|
Acquired revenue is not separately disclosed in Q2
|
Lowe's FBM and ADG assets, regional distributors
|
Home Depot leads in scale, but both large chains are buying Pro capabilities
|
|
Capital intensity and valuation
|
Approximately $343 billion equity value at August 19 price
|
Based on Q2 diluted shares, not a live market-cap feed
|
Lowe's, Floor & Decor, Tractor Supply
|
Premium quality is justified, but 23 times guided adjusted EPS requires continued s
hare gains
|
|
Company
|
Latest comparable period
|
Revenue or operating scale
|
Growth and profitability signal
|
Strategic and capital position
|
Competitive conclusion
|
|
Home Depot
|
Fiscal Q2 ended August 2, 2026
|
$47.86 billion sales; 2,364 stores plus more than 1,340 SRS locations
|
Sales +5.7%; comparable sales +1.7%; GAAP operating margin 14.29%
|
Integrating specialty distribution; first-half capex $1.72 billion
|
Current winner on scale and comps, but traffic remains negative
|
|
Lowe's
|
Fiscal Q2 ended July 31, 2026
|
$26.0 billion sales; 1,761 stores plus 540 branches
|
Comparable sales +0.2%; adjusted EPS +1.6% to $4.40
|
Pro, online, and home services grew; annual comparable-sales outlook cut to flat
|
Direct rival is profitable but losing relative comp momentum
|
|
Floor & Decor
|
Fiscal Q2 ended June 25, 2026
|
$1.25 billion sales; 281 warehouse stores and five design studios
|
Sales +3.0%; comparable sales -2.1%; adjusted EPS $0.58
|
Opened five warehouses; exposed to discretionary flooring projects
|
Relative loser in current large-project demand environment
|
|
Tractor Supply
|
Fiscal Q2 ended June 27, 2026
|
$4.54 billion sales
|
Sales +2.3%; comparable sales -1.5%; adjusted EPS $0.81
|
Restructuring Petsense and updating outlook after weak seasonal demand
|
Needs-based categories are resilient, but latest traffic and comps lag
|
Home Depot is the relative winner in the latest reporting cycle. Its comparable-sales growth exceeded all three listed peers, and its professional distribution footprint is difficult to replicate organically. Lowe's remains the most credible direct competitor because it is also building professional capabilities through acquired branches and because its online sales increased 15.7% in Q2. Yet Lowe's reduced its full-year comparable-sales outlook from flat to positive 2% to flat, while Home Depot retained a flat-to-positive-2% range. That difference favors Home Depot's share narrative.
Floor & Decor is the clearest loser from weak large discretionary projects: its negative 2.1% comparable sales contrast with Home Depot's positive result, although improving monthly trends and new-store growth keep total revenue positive. Tractor Supply is an adjacent rather than direct substitute, but its negative comparable sales and transaction count show that weak seasonal and discretionary demand is not unique to home improvement.
The net conclusion is that Home Depot is a competitive beneficiary, not merely a cyclical passenger. However, the stock valuation captures much of that benefit. Continued relative outperformance must progress from ticket-led comparable sales to positive transactions and better operating leverage. Otherwise the company can win share while the equity produces only modest returns.
5. Key Risks
-
Housing turnover and large-project demand remain structurally weak. If mortgage rates and affordability keep existing-home transactions depressed through fiscal 2027, big-ticket renovation demand may not recover. Comparable transactions could remain negative, limiting organic sales and preventing the operating-margin recovery embedded in a premium earnings multiple.
-
Ticket growth may be masking traffic weakness. Q2 average ticket increased 2.8% while comparable transactions declined 1.0%. If ticket growth falls below 1% before transactions turn positive, comparable sales could move back toward zero. Fixed store, labor, and delivery costs would then pressure operating income faster than revenue.
-
Acquisition growth may fail to produce sufficient returns. Goodwill and intangible assets reached $33.38 billion, and acquired-intangible amortization reduced GAAP results. If SRS and subsequent acquisitions do not generate cross-selling and procurement benefits, adjusted metrics may overstate economic profitability, debt reduction may slow, and the valuation multiple may compress.
-
Expense growth can overwhelm gross-margin progress. Q2 gross margin improved, but selling, general and administrative expense increased 8.5%, faster than sales. If annual adjusted operating margin falls below 12.8%, the low end of guidance, investors would likely reassess both integration execution and the sustainability of EPS growth.
-
Tariff and input-cost benefits are uncertain and partly nonrecurring. Fiscal 2026 guidance includes IEEPA tariff refunds that are expected to offset some fuel, energy, and product costs. A reversal in trade-policy treatment or higher replacement costs could reduce gross margin and force selective price increases, which may further weaken transactions.
-
Leverage constrains downside protection. Total short- and long-term debt was approximately $$52.90 billion at Q2 end versus$$2.09 billion of cash. Stable cash flow supports the structure, but a prolonged earnings downturn, expensive refinancing, or a large integration setback could redirect free cash flow from dividends and investment toward debt service.
-
The valuation leaves limited room for an ordinary result. At about 23 times the midpoint of adjusted EPS guidance, the share price assumes category leadership and eventual housing normalization. If fiscal 2027 EPS growth remains in the low single digits, a decline to a 20 times multiple could produce a price near $300 even without an absolute earnings contraction.
6. Monitoring Checklist
-
Comparable transactions: positive growth would strengthen the recovery thesis; below negative 1% for two more quarters would weaken it materially.
-
Comparable sales: above 2% would indicate performance beyond the current full-year guide; below zero would invalidate the near-term improvement thesis.
-
Average ticket: 1% to 3% growth with improving traffic is constructive; ticket below 1% while traffic remains negative points to renewed stagnation.
-
Adjusted operating margin: at least 12.8% for fiscal 2026 is required to preserve the current earnings framework; below that threshold suggests acquisition and expense drag.
-
First-half cash conversion normalization: full-year simplified free cash flow should remain above 80% of net income after working-capital timing reverses; a lower ratio would weaken balance-sheet flexibility.
-
Professional ecosystem integration: look for disclosed SRS growth, cross-selling, delivery productivity, and declining acquired-intangible adjustment burden. Lack of measurable progress would lower confidence in acquisition returns.
-
Peer spread: Home Depot should maintain at least a one-point comparable-sales advantage over Lowe's or show superior operating leverage. A sustained Lowe's catch-up would challenge the share-gain thesis.
-
Housing catalyst: improving existing-home transactions and lower financing costs should translate into positive big-ticket and project demand. If housing activity improves without Home Depot traffic responding, the competitive thesis would be impaired.
7. Sources