Author: LBank Research Analyst: Ludo
Disclaimer: This report is compiled and analyzed from publicly available information and is intended solely for information sharing and research discussion. It does not constitute investment advice, a securities recommendation, a trading instruction, or any guarantee of returns. The company operations, valuations, market prices, and consensus expectations discussed herein may change over time. Readers should independently verify the data and make their own decisions.
1. Core Conclusion
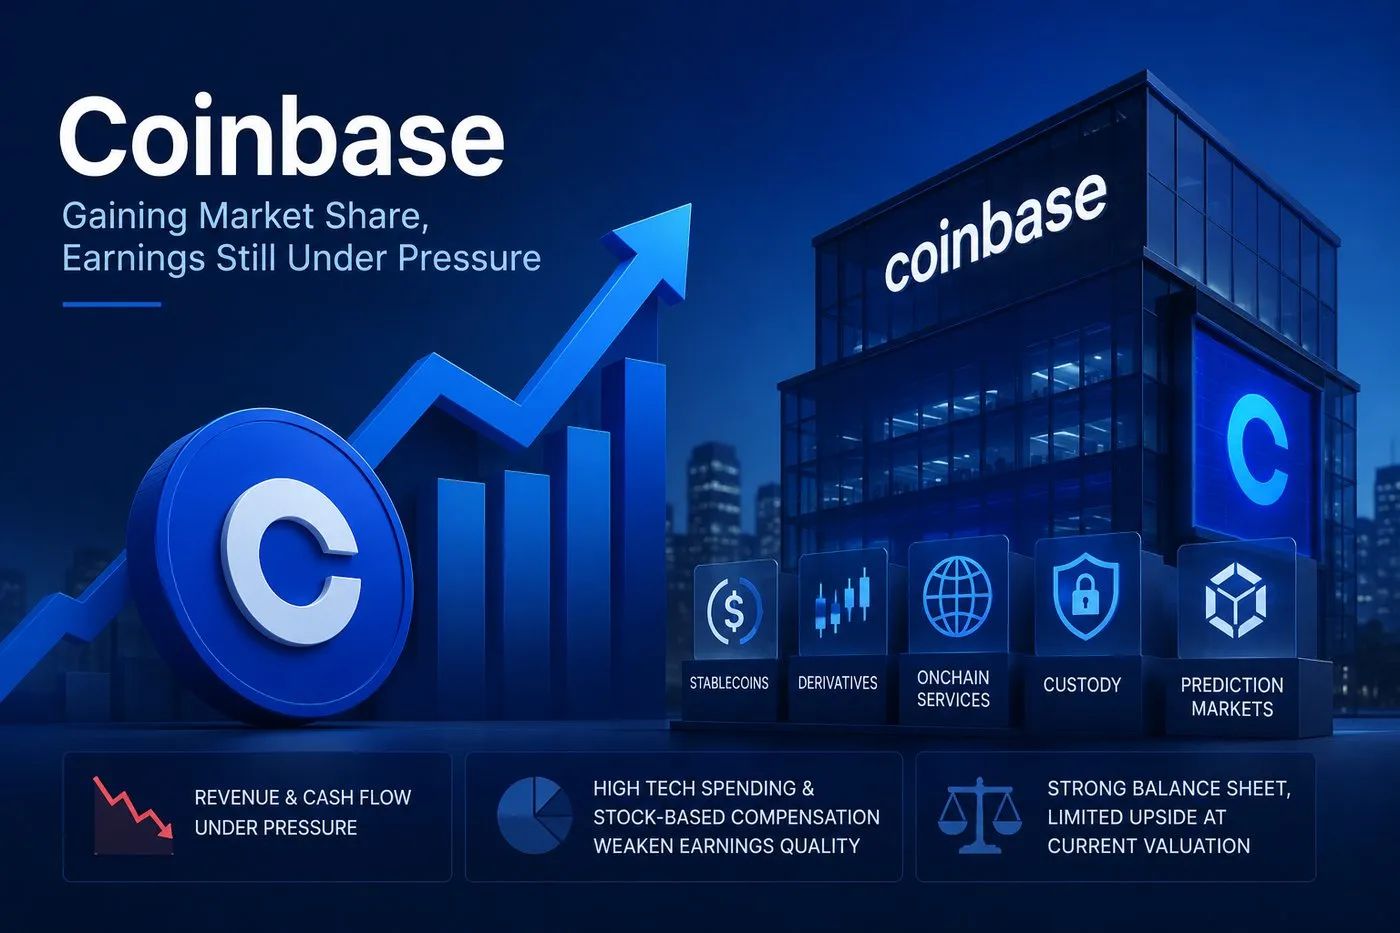
Overall judgment: Coinbase is the strongest broad-service public crypto platform in the United States, but the stock's risk-reward is slightly negative at the current valuation because market-share gains and product breadth have not yet translated into durable GAAP earnings or cash-flow growth; the decisive variable is whether non-spot products can lift revenue faster than technology spending and stablecoin-rate pressure.
-
The franchise is improving even while the income statement is contracting. Coinbase's proprietary crypto trading-volume share reached a record 10.3% in Q2 2026, up from 9.1% in Q1 and 6.3% a year earlier. Derivatives volume stayed near USD 1.03 trillion despite a double-digit decline in the overall derivatives market, and prediction markets crossed USD 100 million of annualized revenue. These gains show that the Deribit acquisition and the Everything Exchange strategy are creating genuine product breadth rather than merely repackaging spot trading.
-
Revenue diversification is real, but it is not yet countercyclical enough. Subscription and services represented 48% of Q2 net revenue versus 45% a year earlier, while 88% of net revenue excluded Bitcoin spot trading. Yet Q2 net revenue still fell 17% year over year to USD 1.154 billion: transaction revenue declined 22%, subscription and services declined 12%, and total revenue declined 19%. Diversification reduced the downside; it did not eliminate the cycle.
-
Adjusted profitability overstates current cash-earnings quality. Q2 adjusted EBITDA remained positive at USD 208 million, but GAAP net loss was USD 359 million, stock-based compensation was USD 238 million, and technology and development expense rose 22% to USD 473 million. H1 operating cash flow fell 65% to USD 380 million. The gap matters because Coinbase spent USD 1.24 billion on repurchases in H1 while operating cash generation was only about one-third of that amount.
-
The balance sheet is strong, but the valuation already assumes a large earnings recovery. At the August 25 close of USD 187.16, market capitalization was approximately USD 49.6 billion and enterprise value approximately USD 47.5 billion. That equals roughly 10.3 times annualized Q2 net revenue and about 57 times annualized Q2 adjusted EBITDA. These mechanical multiples are not forecasts, but they leave little room for a slow recovery in spot activity or sustained rate pressure on stablecoin economics.
-
The thesis can turn positive, but the burden of proof is quantitative. A favorable re-rating would require Coinbase to hold crypto trading share above 10%, keep quarterly derivatives volume above USD 1 trillion, grow subscription and services back above USD 600 million, and restore quarterly adjusted EBITDA above USD 400 million without stock-based compensation rising faster than revenue. Failure to meet those thresholds would confirm that product proliferation is increasing complexity faster than monetization.
The central transmission chain is reproducible. If total crypto spot volume returns to the Q1 2026 level while Coinbase holds its 10.3% share, Coinbase spot volume would rise from USD 146.4 billion toward roughly USD 193 billion, an increase of about 32%. Applying Q2 transaction revenue intensity of USD 599 million divided by USD 146.4 billion of spot volume gives an intentionally conservative upper-bound sensitivity of about 0.41%; even applying only half that rate to the incremental volume would add about USD 96 million of quarterly transaction revenue. If 60% of that increment reached adjusted EBITDA, quarterly adjusted EBITDA would rise by about USD 58 million. The valuation therefore needs either a larger market recovery, structurally higher monetization from derivatives and prediction products, or better cost conversion than this simple scenario provides.
2. Company Overview, Business Mix, and Core Operating Metrics
Coinbase is evolving from a U.S. retail crypto broker into a multi-asset financial platform spanning spot crypto, derivatives, stablecoins, custody, institutional financing, payments, prediction markets, equities, and onchain infrastructure. Consumers pay explicit or spread-based trading fees and subscribe to Coinbase One. Institutions pay execution, custody, financing, and related service fees. Developers and merchants use Base, wallets, APIs, stablecoin rails, and the x402 payment protocol. The business therefore combines an exchange, a broker, a custodian, a fintech infrastructure provider, and an onchain software platform.
The consumer transaction franchise remains the largest single revenue pool. Q2 consumer transaction revenue was USD 452 million, down 31% year over year as consumer crypto spot volume fell 38%. The institutional business moved the other way: revenue rose 65% to USD 100 million, primarily because Deribit expanded Coinbase into global crypto options and perpetuals. Other transaction revenue, including Base and adjacent activities, was USD 47 million.
Stablecoins are the largest recurring revenue source. Coinbase co-founded USDC, distributes it through its products, and shares reserve economics with Circle. Q2 stablecoin revenue was USD 292 million, down only 5% despite lower interest rates because average balances grew. Blockchain rewards fell 42% to USD 83 million as lower asset prices reduced staking economics. Interest and finance fees grew 11% to USD 66 million, supported by lending and institutional financing, while other subscription and services revenue was USD 114 million.
|
Q2 2026 business line
|
Products and customers
|
Revenue
|
Year-over-year change
|
Share of net revenue
|
Research assessment
|
|
Consumer transactions
|
Retail spot trading, simple derivatives, prediction markets, and related execution
|
USD 451.7 million
|
Down 31%
|
39%
|
Largest profit pool, but still highly exposed to retail activity and asset prices
|
|
Institutional transactions
|
Prime execution, Deribit options and perpetuals, institutional liquidity
|
USD 100.1 million
|
Up 65%
|
9%
|
The clearest structural winner; acquisition contribution limits organic comparability
|
|
Other transactions
|
Base sequencer economics and adjacent transaction products
|
USD 47.4 million
|
Down 11%
|
4%
|
Strategically important but not yet a major profit pool
|
|
Stablecoins
|
USDC distribution, reserve economics, payments, merchant and agent settlement
|
USD 292.1 million
|
Down 5%
|
25%
|
Best recurring buffer, but sensitive to rates and Circle distribution terms
|
|
Blockchain rewards
|
Staking and protocol participation for retail and institutional customers
|
USD 83.3 million
|
Down 42%
|
7%
|
Weakest recurring line because token prices and protocol economics drive results
|
|
Financing and other services
|
Lending, Coinbase One, custody, commerce, and infrastructure services
|
USD 179.7 million
|
Down 1%
|
16%
|
Promising bundle, but disclosure is too aggregated to prove uniform quality
|
Note: Shares use Q2 net revenue of USD 1.154 billion and may not sum exactly because of rounding. Financing and other services combine interest and finance fee income with other subscription and services revenue. Other revenue of USD 65.8 million is excluded from the denominator because the company defines net revenue separately.
The most valuable asset is Coinbase's regulated liquidity and custody stack. It allows a customer balance to generate multiple revenue opportunities: trading fees, USDC economics, staking, custody, lending, card spending, and onchain activity. The most important weakness is that this ecosystem still depends on crypto asset prices and volatility for customer engagement. The company stopped presenting legacy trading volume as a key metric in Q2 because its product mix had broadened, but investors should not interpret the disclosure change as evidence that the cycle has disappeared.
Core Operating Metrics and Changes
The Q2 release showed a platform gaining share during a down market. Coinbase total trading volume was USD 1.300 trillion, including USD 146.4 billion of crypto spot volume, USD 1.027 trillion of crypto derivatives volume, USD 33.6 billion of other derivatives, and USD 92.7 billion of stablecoin trading and conversions. Crypto trading-volume share reached 10.3%, and average borrow and lend balances rose to USD 1.491 billion from USD 199 million a year earlier.
|
Metric or event
|
Latest value
|
Comparison
|
Definition
|
Investment meaning
|
|
Total revenue
|
USD 1.220 billion
|
Down 19% year over year and 14% sequentially
|
GAAP total revenue, including USD 65.8 million of other revenue
|
Share gains have not yet offset the lower market activity level
|
|
Crypto trading-volume share
|
10.3%
|
9.1% in Q1 2026 and 6.3% in Q2 2025
|
Company-defined global spot and derivatives competitor set
|
The best evidence that product investment is strengthening the franchise
|
|
Monthly transacting users
|
7.6 million
|
Down from 8.7 million
|
Rolling 28-day active or passive transacting consumers
|
Engagement still contracts when markets weaken
|
|
Assets on platform
|
USD 245.9 billion
|
Down 42% year over year
|
Customer crypto assets and payment stablecoins held or managed by Coinbase
|
Unit inflows were insufficient to offset lower asset prices
|
|
Adjusted EBITDA
|
USD 207.8 million
|
Down 59% year over year
|
Company non-GAAP measure excluding stock compensation and crypto investment marks
|
Positive buffer remains, but earnings power is far below the valuation implied by a normalized cycle
|
|
Capital returns
|
USD 1.24 billion H1 repurchases
|
USD 2.0 billion authorization remaining
|
Cash-settled share repurchases through June 30
|
Supports per-share value but exceeded H1 operating cash flow by more than three times
|
Note: Share statistics are company-defined and should not be compared directly with third-party exchange estimates. The Q2 2026 presentation states that prediction markets exceeded USD 100 million of annualized revenue and that derivatives market share reached a record, but it does not disclose a stand-alone segment margin.
The quarter's most important positive change was not revenue; it was the quality of share gains. Spot gains were concentrated in crypto-to-fiat, the company's highest-revenue channel, while derivatives benefited from perpetuals and the Deribit platform. The most important negative change was cost intensity. Technology and development reached 41% of net revenue, compared with 28% a year earlier. Product velocity is strategically useful, but the cost base is currently absorbing the benefits.
3. Fundamental Quality
|
Financial item
|
FY2024
|
FY2025
|
H1 2025
|
H1 2026
|
Research assessment
|
|
Total revenue
|
USD 6.564 billion
|
USD 7.181 billion
|
USD 3.532 billion
|
USD 2.633 billion
|
Long-term growth exists, but H1 2026 shows the cycle still dominates
|
|
GAAP operating income or loss
|
USD 2.307 billion
|
USD 1.435 billion
|
USD 681 million
|
Loss of USD 135 million
|
Operating leverage reversed sharply as revenue fell and development spending rose
|
|
GAAP net income or loss
|
USD 2.579 billion
|
USD 1.260 billion
|
USD 1.495 billion
|
Loss of USD 754 million
|
Crypto investment marks make GAAP earnings volatile, but the direction is still adverse
|
|
Adjusted EBITDA
|
USD 3.348 billion
|
USD 2.808 billion
|
USD 1.442 billion
|
USD 511 million
|
Positive but down 65% in H1, showing weak fixed-cost absorption
|
|
Operating cash flow
|
USD 3.104 billion
|
USD 2.426 billion
|
USD 1.093 billion
|
USD 380 million
|
Cash generation is positive but substantially below prior periods
|
|
Cash and cash equivalents
|
USD 9.308 billion
|
USD 11.285 billion
|
USD 9.368 billion
|
USD 8.614 billion
|
Liquidity is strong despite debt repayment and repurchases
|
|
Long-term debt
|
USD 4.234 billion
|
USD 7.207 billion including current portion
|
USD 4.596 billion
|
USD 5.944 billion
|
Manageable against cash, but acquisitions increased gross obligations
|
Note: FY2024 and FY2025 figures come from the 2025 Form 10-K; interim figures come from the Q2 2026 Form 10-Q. H1 long-term debt uses period-end carrying values. Free cash flow is not shown because Coinbase's lending, collateral, and payment-stablecoin cash flows make a generic operating-cash-flow-minus-capex metric less comparable than for a conventional software company.
Growth and margins. Coinbase's growth quality is mixed. Market share, derivatives, stablecoin balances, borrow and lend balances, and prediction markets all improved. However, Q2 consumer transaction revenue fell 31%, MTUs fell 13%, and assets on platform fell 42%. The company is winning within a shrinking revenue pool. That is strategically valuable, but it is not the same as compounding earnings.
Cash flow and investment. H1 operating cash flow of USD 380 million remained positive despite a GAAP loss, partly because stock-based compensation added back USD 486 million. Technology and development spending reached USD 998 million in H1, up 34%. The May restructuring removed about 700 roles and generated USD 52 million of charges, but it must produce a durable reduction in expense growth to improve cash conversion.
Balance sheet and capital allocation. Coinbase held USD 8.6 billion of cash and USD 8.8 billion of cash plus marketable investments at June 30, against USD 6.0 billion of long-term debt principal. Liquidity is therefore not the core risk. Capital allocation is more debatable: the company repaid USD 1.3 billion of convertible debt and repurchased USD 1.24 billion of stock in H1, while spending heavily on acquisitions and product development. Buying shares near an average H1 price around USD 175 can create value if normalized earnings recover, but it reduces flexibility if the crypto downturn lasts.
Fundamental conclusion. The platform quality is strong, the earnings quality is currently weak, and the balance sheet is strong enough to bridge the gap. The single most important variable is operating conversion from non-spot growth: stablecoins, derivatives, prediction markets, and financing must raise revenue without keeping technology and development near 40% of net revenue.
4. Industry and Competitive Landscape
The relevant industry is broader than centralized crypto exchanges. Coinbase competes with retail brokers such as Robinhood for customer attention and transaction economics; specialist crypto venues for liquidity; CME for regulated institutional derivatives; Circle for stablecoin economics and distribution control; banks and custodians for institutional assets; and decentralized protocols for onchain execution and lending. Industry economics flow from customer assets to trading, custody, reserve income, financing, staking, payments, and data. Scale improves liquidity and unit costs, while regulation, security, and custody create switching costs.
|
Competitive dimension
|
Coinbase position
|
Scale evidence and limitation
|
Main competitors
|
Growth, margin, and valuation implication
|
|
Retail distribution
|
Leading U.S. crypto-native consumer brand with 7.6 million MTUs
|
MTUs are company-defined and exclude simple account counts
|
Robinhood, Kraken, Gemini, decentralized wallets
|
Coinbase retains crypto depth, but Robinhood is winning broader financial engagement
|
|
Spot and derivatives liquidity
|
Record 10.3% company-defined crypto volume share; Deribit adds options leadership
|
Competitor set is proprietary; share is not an audited industry statistic
|
Binance, Kraken, CME, Robinhood and offshore venues
|
Share gains support future operating leverage if the market pool recovers
|
|
Stablecoin network
|
Co-founder and major distributor of USDC; average USDC held in products reached USD 20 billion
|
Circle controls issuance and reserve management; economics are contract-dependent
|
Circle, Tether, PayPal, bank-issued stablecoins
|
Balances can offset rate cuts, but distribution pricing may compress margins
|
|
Custody and institutional trust
|
USD 245.9 billion of assets on platform across consumer and institutional products
|
Asset prices drive the value; unit custody trends are more durable than reported dollars
|
Fidelity, Anchorage, BitGo, banks and self-custody
|
|
|
Onchain infrastructure
|
Base, x402, wallets, wrapped assets, lending and agentic payment tools
|
Usage is expanding, but stand-alone revenue and margin disclosure remain limited
|
Ethereum layer-two networks, Solana, decentralized exchanges, fintech APIs
|
Largest long-duration option value, but also the hardest segment to value today
|
|
Company
|
Latest comparable period
|
Revenue or key metric
|
Growth or profitability
|
Operating and capital posture
|
Competitive conclusion
|
|
Coinbase
|
Q2 2026
|
USD 1.220 billion revenue; 10.3% crypto volume share
|
Revenue down 19%; USD 208 million adjusted EBITDA
|
Heavy product investment, Deribit integration, restructuring and active buybacks
|
Net strategic winner in crypto breadth, but not yet an earnings winner
|
|
Robinhood
|
Q2 2026
|
USD 1.308 billion revenue; USD 100 million crypto revenue
|
Revenue up 32%; net income USD 561 million
|
Broad brokerage, options and event contracts offset crypto weakness
|
Winning consumer monetization and profitability; losing crypto revenue momentum
|
|
CME Group
|
Q2 2026
|
USD 1.706 billion revenue; crypto notional volume USD 459.2 billion
|
GAAP operating margin 65%; crypto ADV up 32%
|
Capital-efficient clearing network with 24-hour crypto futures and options
|
Institutional derivatives winner with superior margins, but narrower crypto stack
|
|
Circle
|
Q2 2026
|
USD 701 million revenue and reserve income; USD 73.3 billion USDC circulation
|
Revenue up 7%; adjusted EBITDA USD 143 million
|
Focused stablecoin issuer investing in Arc and programmable finance
|
Wins when USDC expands, but Coinbase captures distribution economics and customer relationships
|
Note: Peer metrics are not fully comparable. Robinhood includes brokerage, interest, options, and event contracts; CME reports exchange-wide results and crypto notional volume; Circle's revenue is dominated by reserve income. Coinbase adjusted EBITDA and Circle adjusted EBITDA are company-defined non-GAAP measures.
Robinhood is currently winning the consumer profit contest. Its Q2 revenue rose 32% to USD 1.31 billion and net income reached USD 561 million even though crypto revenue fell 38% to USD 100 million. Options, equities, interest income, and event contracts absorbed the crypto decline. Coinbase has deeper crypto products and custody, but Robinhood has demonstrated better cross-asset monetization.
CME is winning the institutional margin contest. Q2 crypto average daily volume rose 32% to 250,000 contracts, and crypto notional volume reached USD 459 billion. Across the company, CME produced a 65% GAAP operating margin. Coinbase offers a more complete crypto stack and more direct customer assets, but CME's clearing network delivers much better operating economics.
Circle is both partner and bargaining counterparty. USDC circulation grew 19% to USD 73.3 billion, while Q2 revenue and reserve income rose 7% to USD 701 million. Coinbase benefits from USDC distribution and held USD 20 billion of average USDC in its products, but lower rates reduced Q2 stablecoin revenue by USD 55.9 million before balance growth offsets. Coinbase is the net beneficiary of a larger USDC network, yet the revenue-sharing relationship limits its control over the full profit pool.
Overall, Coinbase is a net strategic winner because it is gaining crypto market share and owns the broadest public-company stack from custody to derivatives to onchain applications. It is a net financial laggard versus Robinhood and CME because its cost conversion and GAAP margins are weaker. The stock should not receive a full platform premium until that gap narrows.
5. Key Risks
-
Crypto activity remains the dominant revenue driver. If crypto spot volume remains below the Q2 2026 level or volatility falls further, consumer transaction revenue can decline faster than share gains can compensate, reducing fixed-cost absorption and adjusted EBITDA.
-
Stablecoin economics are rate-sensitive and contract-dependent. Another 100 basis points of reserve-yield compression, without equivalent growth in USDC balances, would pressure stablecoin revenue and could remove the most reliable buffer against trading weakness.
-
Product breadth may create cost without adequate monetization. If technology and development remains near 40% of net revenue while prediction, equities, payments, and agent products stay below meaningful scale, cash margins will remain below the level embedded in the valuation.
-
Deribit and other acquisitions add integration and goodwill risk. Coinbase carried USD 4.14 billion of goodwill and USD 1.32 billion of net intangible assets at June 30. A sustained derivatives slowdown or customer attrition could impair expected acquisition returns.
-
Regulatory permission can expand or contract quickly. Changes affecting stablecoins, staking, derivatives, prediction markets, tokenized securities, custody, or market structure could restrict products, increase capital requirements, or raise compliance costs.
-
Security and operational failures can destroy trust. The 2025 data-theft incident required customer reimbursements and legal costs. A larger custody, wallet, identity, or third-party breach could cause withdrawals, regulatory action, and a valuation de-rating.
-
Capital returns may outrun internally generated cash. H1 repurchases of USD 1.24 billion exceeded H1 operating cash flow of USD 380 million. Continued buybacks during a prolonged downturn would reduce liquidity and could force slower investment or new financing.
6. Monitoring Checklist
-
Coinbase crypto trading-volume share: above 10% reinforces the moat; below 9% for two quarters would weaken the share-gain thesis.
-
Quarterly crypto derivatives volume: above USD 1 trillion supports Deribit economics; below USD 850 billion would indicate that the acquisition is not holding share.
-
Subscription and services revenue: a return above USD 600 million would show that stablecoins and services can grow through a weak spot market; below USD 525 million would signal an inadequate buffer.
-
Technology and development intensity: below 35% of net revenue would strengthen cash-conversion confidence; persistence near or above 40% would weaken it.
-
Adjusted EBITDA and stock-based compensation: adjusted EBITDA above USD 400 million with stock compensation below 18% of net revenue would be constructive; the reverse would confirm low earnings quality.
-
Assets on platform and MTUs: native-unit growth matters more than price-driven dollar growth; MTUs below 7 million would indicate weakening engagement.
-
USDC balances and Circle economics: average USDC held in Coinbase products above USD 22 billion could offset rate pressure; adverse changes to distribution terms would directly weaken stablecoin margins.
-
Competitor signals: monitor Robinhood crypto revenue and event-contract growth, CME crypto ADV and open interest, and Circle USDC circulation. Coinbase needs to gain share without allowing these competitors to capture the highest-margin use cases.
7. Sources
-
-
-
Coinbase Q2 2026 earnings release, July 30, 2026 (https://investor.coinbase.com/news/news-details/2026/Coinbase-Q2-Earnings-Everything-Exchange-Drives-3rd-Consecutive-Quarter-of-Record-Crypto-Trading-Volume-Market-Share-Revenue-Diversification-and-Resilience/default.aspx)
-
-
-
-
-
-
-
-
-
-
-