Author: LBank Research Analyst: Ludo
Disclaimer: This report is compiled and analyzed from publicly available information and is intended solely for information sharing and research discussion. It does not constitute investment advice, a securities recommendation, a trading instruction, or any guarantee of returns. The company operations, valuations, market prices, and consensus expectations discussed herein may change over time. Readers should independently verify the data and make their own decisions.
1. Core Conclusion
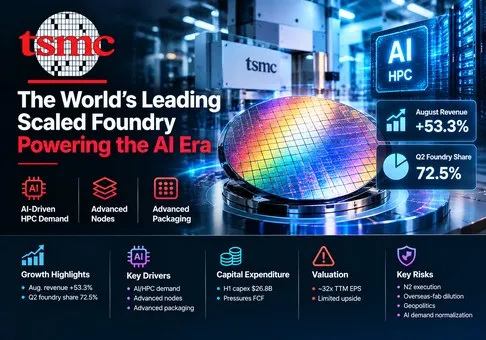
Overall view: Taiwan Semiconductor Manufacturing Company Limited is the highest-quality scaled foundry in the semiconductor industry, but the NYSE-listed TSM ADR is fully valued with a negative risk-reward skew at roughly 32 times mechanically calculated TTM EPS. August revenue and a 72.5% Q2 foundry share confirm that the moat is widening; the decisive variable is whether N2, advanced packaging, and overseas capacity can preserve margins and cash conversion as the market already prices in durable supremacy.
-
August revenue validates an exceptional growth engine. Unaudited August revenue reached a record NTD 514.81 billion, up 53.3% year over year, while January–August revenue increased 39.3% to NTD 3.387 trillion. This is not a one-product spike: Q2 HPC represented 66% of revenue, smartphone 22%, and 7nm-and-below technologies 77% of wafer revenue. The investment implication is that AI accelerators, custom XPU, CPUs, networking silicon, and premium smartphones are reinforcing the same leading-edge capacity pool.
-
TSMC is winning both volume and value share. Q2 wafer shipments rose 16.6% year over year, revenue rose 36.0%, and gross margin expanded 9.1 percentage points to 67.7%. Revenue therefore grew about twice as fast as shipment volume, evidence of richer node mix, pricing, and utilization. TrendForce estimates that TSMC captured 72.5% of top-ten foundry revenue in Q2, up from 70.2% a year earlier, while Samsung Foundry held only 5.9%. The moat is producing measurable operating leverage rather than merely a technology narrative.
-
Earnings quality is strong, but FCF is becoming the constraint. Q2 operating cash flow was NTD 783.36 billion and FCF was NTD 287.36 billion after NTD 496.00 billion of capex. FCF rose 43.8% year over year but fell 17.5% sequentially because capex rose faster than cash generation. H1 capex reached USD 26.8 billion against full-year guidance of USD 52–56 billion. TSMC can self-fund the buildout and held NTD 2.486 trillion of net cash reserves, yet each incremental fab now consumes more of the earnings advantage before it reaches shareholders.
-
The equity price already discounts sustained category dominance. At the September 11 close of USD 433.19 and approximately 5.186 billion ADR-equivalent shares, equity value is about USD 2.25 trillion. Mechanically calculated TTM diluted EPS is approximately USD 13.53 per ADR, implying 32.0 times TTM earnings. Annualizing H1 FCF produces roughly USD 40.2 billion and a 1.8% FCF yield. A 42.6% year-to-date stock gain and 67% one-year gain leave little room for an ordinary cyclical slowdown, even though the business itself deserves a premium.
-
The thesis is positive on the company and cautious on the stock, with explicit reversal conditions. The valuation concern would ease if Q3 revenue lands near the USD 45.2 billion guidance midpoint, September revenue exceeds NTD 464 billion, gross margin remains at or above 66%, and annualized FCF rises above USD 50 billion without another capex step-up. It would worsen if advanced-node utilization softens, gross margin falls below 64%, inventory days remain above 90, or the ADR stays above 30 times TTM EPS while growth decelerates below 25%.
The operating-to-valuation chain is reproducible. July and August revenue totaled NTD 982.39 billion. Reaching the Q3 revenue midpoint of USD 45.2 billion at management's NTD 32 per USD assumption requires about NTD 1.446 trillion, leaving approximately NTD 464.0 billion for September. That would be 9.9% below the record August level but still sufficient to meet guidance. Applying the 57% operating-margin midpoint yields about NTD 824.4 billion of quarterly operating profit. The August release therefore supports the guided quarter; the valuation question is whether this run rate can compound long enough to justify roughly 32 times trailing earnings and a sub-2% annualized FCF yield.
2. Company Overview, Business Mix, and Core Operating Metrics
TSMC is a dedicated semiconductor foundry: customers design chips, and TSMC manufactures them using process technologies, factory systems, design enablement, and increasingly advanced packaging. It does not compete with most customers by selling branded processors. That neutrality, combined with technology leadership and manufacturing yield, lets customers such as fabless chip designers and system companies commit their most valuable designs to TSMC. Wafer fabrication produced approximately 86% of 2025 revenue; packaging and testing, mask making, design services, and royalties produced the remainder.
The company earns money through wafer volume, process-node pricing, product mix, capacity utilization, and attached services. Leading-edge nodes carry high development and equipment costs but also command better pricing and attract the fastest-growing applications. Advanced packaging such as CoWoS and 3DFabric® adds value after wafer fabrication and can reinforce front-end demand because AI accelerators require integrated compute, memory, and interconnect. Customers generally place manufacturing orders closer to production, although some pay temporary receipts to reserve capacity.
TSMC reports platform mix rather than separate operating segments. HPC now drives the economics. In Q2 it represented 66% of revenue and grew 20% sequentially, while smartphone revenue fell 4% sequentially and represented 22%. Automotive, IoT, and DCE provide diversification but are too small to offset an AI correction. Geographically, North American-headquartered customers produced 78% of Q2 revenue, which aligns the company with the strongest AI demand but also concentrates commercial and policy exposure.
|
Platform / service
|
Q2 2026 revenue mix
|
Sequential change
|
Products, customers, and economics
|
Research view
|
|
HPC
|
66%
|
up 20%
|
AI accelerators, custom XPU, CPUs, networking and data-center silicon; leading nodes and advanced packaging drive value.
|
The dominant growth and profit pool; its scale makes TSMC the broadest supplier to competing AI architectures.
|
|
Smartphone
|
22%
|
down 4%
|
Application processors, modems and connectivity silicon for premium mobile devices, concentrated in seasonal flagship ramps.
|
Still a large utilization anchor, but structurally less important than HPC and sensitive to consumer affordability.
|
|
IoT
|
5%
|
up 4%
|
Connected-device controllers, edge processors and specialty chips across a broad customer base.
|
Useful diversification with less pricing power and a modest group contribution.
|
|
Automotive
|
4%
|
up 15%
|
ADAS, infotainment, microcontrollers and power-related devices with long qualification cycles.
|
A recovering, sticky business, but too small to drive near-term group earnings.
|
|
DCE and other
|
3%
|
up about 5%
|
Consumer electronics plus packaging, testing, masks, design services and royalties not captured by the main platforms.
|
Strategically supportive; advanced packaging matters more than the reported residual mix suggests.
|
Note: Platform mix and sequential changes are company disclosures. DCE means Digital Consumer Electronics. TSMC does not disclose platform-level operating margins.
The process mix explains why revenue is outrunning unit shipments. N2 contributed 3% of Q2 wafer revenue in its first reported quarter, N3 contributed 30%, N5 33%, and N7 11%. The combined 77% advanced-node mix was three percentage points above Q2 2025. Moving customers into smaller nodes raises ASP and creates more demand for design enablement and packaging, but initial ramp costs lower margins before yields mature.
The most valuable asset is not a single fab. It is the repeatable system connecting process R&D, customer design kits, yield learning, scale purchasing, and trusted execution. The most important constraint is capital intensity: TSMC must commit equipment years before revenue, while global diversification makes early-stage fabs structurally less profitable than mature Taiwan capacity.
Core Operating Metrics and Changes
The immediate trigger is the September 10 monthly release. August revenue was NTD 514.81 billion, 10.1% above July and 53.3% above the prior year. The first eight months reached NTD 3.387 trillion, up 39.3%. The result followed Q2 revenue at the top of guidance and supports the Q3 midpoint without requiring another monthly record.
|
Metric / event
|
Latest value
|
Comparison
|
Basis
|
Investment meaning
|
|
August revenue
|
NTD 514.81 billion
|
up 53.3% YoY; up 10.1% MoM
|
Unaudited TIFRS consolidated monthly revenue
|
A record month confirms that AI and seasonal smartphone ramps are filling leading-edge capacity.
|
|
January–August revenue
|
NTD 3.387 trillion
|
up 39.3% YoY
|
Unaudited cumulative monthly revenue
|
Growth is close to management's slightly-above-40% USD full-year outlook despite currency differences.
|
|
Q2 revenue
|
USD 40.20 billion
|
up 33.7% YoY; up 12.0% QoQ
|
TIFRS; company USD translation
|
Reached the top of guidance and established a high base for Q3.
|
|
Gross / operating margin
|
67.7% / 60.3%
|
up 9.1 / 10.7 points YoY
|
Consolidated company disclosure
|
Pricing, mix and utilization more than offset overseas-fab dilution in Q2.
|
|
N2 / N3 / N5 / N7 mix
|
3% / 30% / 33% / 11%
|
77% combined
|
Share of wafer revenue
|
Leading nodes are the core source of ASP, share and margin advantage.
|
|
Q2 OCF / capex / FCF
|
NTD 783.36 / 496.00 / 287.36 billion
|
FCF up 43.8% YoY; down 17.5% QoQ
|
FCF equals OCF less capex
|
Cash generation is excellent, but the investment ramp is absorbing a rising share of it.
|
|
Q3 guidance
|
USD 44.6–45.8 billion
|
11%–14% above Q2
|
Assumes NTD 32 per USD
|
July and August imply September revenue near NTD 464 billion at the midpoint.
|
Note: MoM growth is calculated from company monthly figures. The Q3 sequential range is calculated against Q2 revenue of USD 40.20 billion. Percentage-point comparisons use unrounded company disclosures.
Q2 reported net income rose 77.4%, but NTD 63.20 billion of disposal and mark-to-market gains on VIS shares inflated non-operating income. Operating income still rose 65.4%, so the underlying result was powerful even after excluding the gain. The more important forward change is margin: management expects N2 ramp to dilute second-half gross margin by three to four percentage points and overseas fabs to dilute gross margin by two to three points initially, widening to three to four points later.
Inventory days rose from 76 to 87 year over year, mainly due to N2 ramp, while receivable days rose from 23 to 29. These increases are manageable beside 36% revenue growth and NTD 2.486 trillion of net cash, but they identify where an oversupply turn would first appear. Strong monthly revenue currently argues that the inventory build is productive rather than speculative.
3. Fundamental Quality
|
Metric
|
2023
|
2024
|
2025
|
H1 2026
|
Research view
|
|
Revenue
|
NTD 2.162 trillion
|
NTD 2.894 trillion
|
NTD 3.809 trillion
|
NTD 2.404 trillion
|
Growth accelerated from 33.9% in 2024 to 31.6% in 2025 and 35.6% in H1 2026.
|
|
Gross margin
|
54.4%
|
56.1%
|
59.9%
|
67.0%
|
Node mix, utilization and pricing created exceptional incremental economics.
|
|
Operating margin
|
42.6%
|
45.7%
|
50.8%
|
59.3%
|
Operating leverage is the clearest evidence that TSMC is capturing the AI profit pool.
|
|
Net income attributable to parent
|
NTD 851.74 billion
|
NTD 1.158 trillion
|
NTD 1.698 trillion
|
NTD 1.279 trillion
|
H1 growth of 68.3% includes a Q2 VIS gain but still materially trails operating-income quality.
|
|
Operating cash flow
|
NTD 1.242 trillion
|
NTD 1.826 trillion
|
NTD 2.275 trillion
|
NTD 1.482 trillion
|
Cash generation scales with earnings despite higher working-capital needs.
|
|
Capex / FCF
|
NTD 949.82 / 292.15 billion
|
NTD 956.01 / 870.17 billion
|
NTD 1.272 / 1.003 trillion
|
NTD 846.77 / 635.58 billion
|
FCF remains positive, but H1 capex intensity rose to 35.2% of revenue.
|
|
Cash and marketable securities / interest-bearing debt
|
Not shown
|
NTD 2.422 trillion / not shown
|
NTD 3.069 / 1.033 trillion
|
NTD 3.518 / 1.032 trillion
|
The net-cash balance sheet provides substantial strategic and cyclical protection.
|
Note: Annual data use TIFRS as reported in the 2025 Form 20-F. H1 2026 is unaudited. FCF equals operating cash flow less capital expenditures. H1 cash, securities, and debt are June 30 balances, not period flows.
Growth and margins. Fundamental quality is exceptional. From 2023 through 2025, revenue increased 76%, operating margin expanded 8.2 percentage points, and net income attributable to the parent nearly doubled. H1 2026 raised the operating margin another 8.5 points year over year. This is the combination investors want from a scarce asset: strong volume, rising value per wafer, and operating leverage.
Cash flow and capital expenditure. Cash conversion is good in absolute terms but weaker than the accounting margin implies. H1 OCF equaled 61.6% of revenue, while capex consumed 35.2%, leaving FCF at 26.4% of revenue. Annualizing H1 FCF gives approximately NTD 1.271 trillion, or USD 40.2 billion at NTD 31.6 per USD. Against equity value near USD 2.25 trillion, the implied yield is only 1.8%. Investors are paying for future capacity returns before those fabs fully contribute.
Balance sheet and capital allocation. June cash and marketable securities exceeded interest-bearing debt by NTD 2.486 trillion. The company can fund the guided USD 52–56 billion capex program from operations and still pay dividends. Unlike weaker foundries, TSMC does not need external capital to prove a new node. Capital allocation is therefore strategically sound, but the hurdle rate embedded in the share price is demanding.
Fundamental conclusion. The business is very strong. The single most important variable is the cash return on N2, advanced packaging, and overseas fabs: revenue growth must remain high enough that initial yield and location dilution do not drag gross margin below the mid-60s or trap FCF yield below 2%.
4. Industry and Competitive Landscape
The relevant industry is merchant wafer foundry, not the entire semiconductor market. Revenue-share comparisons include external foundry sales and can differ in treatment of packaging, internal wafers, and currency. TrendForce's top-ten foundry revenue framework is the closest current denominator; company filings provide the more reliable margin and capital data. TSMC's edge is greatest in leading logic and advanced packaging, while UMC and GlobalFoundries focus more on mature and specialty technologies. Intel is building an external foundry business but still manufactures mostly for its own product groups.
|
Competitive dimension
|
TSMC's verifiable position
|
Scale proxy and limitation
|
Main competitors / substitutes
|
Growth and valuation implication
|
|
Foundry scale
|
TrendForce estimates 72.5% of top-ten Q2 foundry revenue.
|
Revenue share, not wafer volume or leading-node capacity share.
|
Samsung Foundry, SMIC, UMC, GlobalFoundries and Intel Foundry.
|
Scale spreads R&D and equipment learning across the broadest demand base.
|
|
Leading nodes
|
N2 entered volume production in 2025 and contributed 3% of Q2 2026 wafer revenue; N3 contributed 30%.
|
Revenue mix does not disclose absolute capacity or customer yields.
|
Samsung SF2 and Intel 18A; customers can delay migrations or use older nodes.
|
Successful ramps sustain ASP and lock in next-generation designs.
|
|
Advanced packaging
|
CoWoS and 3DFabric® link accelerator, HBM and interconnect demand to front-end wafers.
|
TSMC does not separately disclose quarterly packaging revenue or margin.
|
Samsung integrated offerings, Intel EMIB/Foveros, OSAT providers and customer-designed alternatives.
|
Packaging expands wallet share but adds another capacity bottleneck.
|
|
Customer trust and ecosystem
|
Dedicated-foundry neutrality, OIP design enablement, broad IP and EDA support, and multi-node execution.
|
Top ten customers were 78% of 2025 revenue; the two largest were 19% and 17%.
|
Samsung and Intel combine product and foundry operations; mature-node peers compete on cost and availability.
|
Neutrality supports share, while concentration magnifies any large-customer cycle.
|
|
Global capacity and cost
|
Taiwan scale plus expansion in Arizona, Japan and Europe; 13 leading-edge and packaging fabs planned in Taiwan over several years.
|
Overseas ramps are expected to dilute gross margin by two to four points depending on stage.
|
Subsidized U.S., Korean, Chinese, Japanese and European capacity.
|
Geographic resilience improves, but structural cost rises and execution becomes harder.
|
|
Company / business
|
Latest comparable period
|
Revenue / scale
|
Growth / margin
|
Production and capital context
|
Competitive conclusion
|
|
TSMC
|
Q2 2026
|
USD 40.20 billion; 72.5% foundry share
|
33.7% YoY revenue growth; 67.7% gross margin
|
USD 26.8 billion H1 capex; N2 at 3% and advanced nodes at 77% of wafer revenue.
|
The clear winner: growing faster than the market while expanding margins and share.
|
|
Samsung Foundry
|
Q2 2026
|
About USD 3.26 billion; 5.9% foundry share
|
up 1.8% QoQ; margin not separately disclosed
|
Ramping second-generation 2nm mobile products and 4nm LPU and base-die products; targeting double-digit H2 growth.
|
A technology challenger, but losing relative revenue share despite improved foundry earnings.
|
|
Intel Foundry
|
Q2 2026
|
USD 5.77 billion segment revenue; USD 0.29 billion external
|
31% YoY growth; negative 36% operating margin
|
Intel 18A-P entered risk production; most segment activity remains internal and Q2 loss was USD 2.09 billion.
|
Process progress is real, but external scale and economics remain far behind TSMC.
|
|
UMC
|
Q2 2026
|
USD 2.18 billion revenue
|
17.0% YoY growth; 32.5% gross margin
|
85% utilization; 22/28nm was 37% of revenue; 2026 capex raised to USD 2.0 billion.
|
A mature-node winner with improving utilization, but not a direct leading-edge substitute.
|
|
GlobalFoundries
|
Q2 2026
|
USD 1.79 billion revenue
|
6% YoY growth; 28.3% gross margin
|
Specialty and regional manufacturing; Q2 OCF was USD 405 million and adjusted FCF was negative USD 3 million.
|
Profitable specialty exposure, but growth and cash returns lag TSMC's AI-led model.
|
Note: Periods and definitions differ. Samsung Foundry revenue and share are TrendForce estimates; Samsung does not disclose a separate foundry income statement. Intel Foundry includes USD 5.48 billion of intersegment eliminations and is not comparable with merchant sales. UMC and GlobalFoundries concentrate on different node mixes. TSMC gross margin is consolidated rather than foundry-only because the company is overwhelmingly a foundry.
TSMC is the decisive winner. Its Q2 revenue was more than 12 times Samsung Foundry's estimated revenue, while share increased and margins expanded. Samsung is making technical and commercial progress in 2nm and HBM base dies, but a 5.9% share shows that progress has not yet changed industry economics. Intel's 18A milestones matter strategically, yet only USD 293 million of Q2 Foundry revenue was external and the segment lost USD 2.09 billion. TSMC's neutral merchant model, customer breadth, and mature yield system remain materially ahead.
UMC is also winning within mature nodes: 85% utilization, 17% growth, and higher capex show improving demand. GlobalFoundries is profitable and strategically relevant for specialty and regional supply. Neither is a broad substitute for TSMC's leading-edge capacity. The foundry market's profit pool is therefore becoming more concentrated even as multiple governments subsidize local capacity.
TSMC is a net beneficiary of AI infrastructure spending because almost every major accelerator and custom-compute architecture can become a customer. The risk is that dominance creates both valuation and policy burdens: customers will fund alternatives, governments will demand geographic diversification, and investors will capitalize peak margins as if they are permanent.
5. Key Risks
-
AI demand normalization. If cloud providers slow accelerator or custom-silicon deployment and HPC growth falls below 20%, leading-edge utilization would decline. Revenue growth would slow faster than depreciation, compressing gross margin and the premium earnings multiple.
-
N2 ramp and yield risk. N2 represented 3% of Q2 wafer revenue and is expected to dilute second-half gross margin by three to four points. If yield improvement takes longer or customer designs slip, inventory and depreciation would rise before revenue, pushing gross margin below the guided mid-60s.
-
Overseas-fab economics. TSMC expects overseas ramps to dilute gross margin by two to three points initially and three to four points later. Labor, construction, supplier, and utilization disadvantages could make the dilution larger, reducing the cash return on the Arizona, Japan, and Europe buildout.
-
Customer concentration. The ten largest customers generated 78% of 2025 revenue; the two largest generated 19% and 17%. A product delay, insourcing decision, inventory correction, or bargaining shift at a top customer would affect utilization and mix before broader semiconductor demand changed.
-
Geopolitical and trade exposure. Most advanced production and management remain in Taiwan, while 78% of Q2 revenue came from North American-headquartered customers. Conflict, blockade, sanctions, export controls, or policy-driven customer restrictions could interrupt production or reduce the valuation multiple even without an immediate earnings decline.
-
Competition and customer second-sourcing. Samsung and Intel can accept lower near-term returns to establish 2nm or 18A ecosystems. If either achieves competitive yield and external scale, customers may shift marginal designs for resilience, weakening TSMC pricing and share.
-
Capital intensity and FCF compression. H1 capex consumed 35.2% of revenue. If annual capex moves above USD 56 billion while annualized FCF stays below USD 40 billion, the current sub-2% FCF yield would become a structural feature rather than a temporary ramp effect.
-
Valuation compression. At roughly 32 times TTM EPS after a strong 12-month return, the ADR requires sustained growth and margins. A deceleration below 25%, gross margin below 64%, or a broad increase in equity discount rates could drive multiple compression even if TSMC remains the industry leader.
6. Monitoring Checklist
-
September revenue: NTD 464 billion or more would support the Q3 guidance midpoint; below NTD 440 billion would imply a finish near the low end unless currency helps.
-
Q3 revenue and margins: revenue near or above USD 45.2 billion and gross margin at or above 66% strengthen the thesis. Gross margin below 64% would indicate greater N2 or overseas dilution.
-
Monthly growth: sustained year-over-year growth above 30% confirms that AI demand offsets consumer weakness. A drop below 20% for two consecutive months would signal normalization.
-
N2 mix and yield: N2 revenue mix rising above 5% with gross margin holding in the mid-60s would show a healthy ramp. Rising mix with margin below 64% would weaken the economics.
-
HPC mix and growth: HPC remaining above 65% of revenue and growing at least 15% sequentially would reinforce TSMC's role as the broad AI bottleneck.
-
Inventory and receivables: inventory days returning below 85 and receivable days below 28 would improve cash quality. Inventory above 90 alongside slower monthly sales would be a warning.
-
Capex and FCF: full-year capex within USD 52–56 billion and annualized FCF above USD 50 billion would support valuation. FCF below USD 40 billion with higher capex would weaken it.
-
Foundry share: a TrendForce share at or above 72% confirms leadership; a decline below 70% paired with Samsung or Intel external gains would challenge the moat narrative.
-
Peer economics: watch Samsung Foundry's separate profitability signals, Intel Foundry external revenue and operating loss, UMC utilization, and GlobalFoundries gross margin. TSMC should continue to grow faster with at least a 30-point gross-margin advantage over mature-node peers.
-
Valuation: a trailing multiple below 27 times with unchanged operating momentum would improve risk-reward. Above 32 times while growth slows below 30% would make the stock increasingly dependent on multiple expansion.
7. Sources
-
-
-
-
TSMC 2Q26 Earnings Release (https://investor.tsmc.com/english/encrypt/files/encrypt_file/reports/2026-07/a80d7933be643644081584087731f73b22ea5a2c/2Q26%20EarningsRelease.pdf)
-
TSMC 2Q26 Management Report (https://investor.tsmc.com/english/encrypt/files/encrypt_file/reports/2026-07/6f49632674bd2d0fd48cb65aaf89ec6ab510b559/2Q26%20ManagementReport.pdf)
-
-
-
-
-
-
-
-
-
-
-
-