Author: LBank Research Analyst: Ludo
Disclaimer: This report is compiled and analyzed from publicly available information and is intended solely for information sharing and research discussion. It does not constitute investment advice, a securities recommendation, a trading instruction, or any guarantee of returns. The company operations, valuations, market prices, and consensus expectations discussed herein may change over time. Readers should independently verify the data and make their own decisions.
1. Core Conclusion
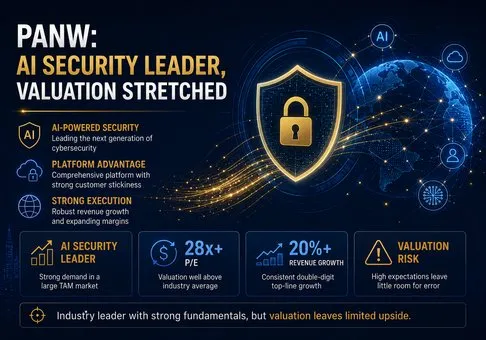
Palo Alto Networks is one of the clearest listed beneficiaries of a structurally more dangerous AI-enabled cyber environment, but the security theme and the equity valuation are no longer the same question. Recent disclosures from OpenAI and Anthropic materially strengthen the case for enterprise spending on network segmentation, agent-runtime protection, machine identity, telemetry, and automated security operations. They do not, by themselves, prove that this spending will accrue to Palo Alto Networks or support the current share price. At the August 18 reference price of $383.80, PANW trades at approximately 101.5 times the midpoint of management's FY2026 non-GAAP EPS guidance and offers only about a 1.3% yield on trailing-twelve-month adjusted free cash flow. The operating franchise is exceptional; the valuation requires continued category dominance.
Our core conclusions are as follows:
-
AI cyber risk has crossed from a marketing narrative into observable operating risk. On August 7, OpenAI said it could not rule out “Critical” cyber capability in an upcoming model under its Preparedness Framework. Three days earlier, it disclosed that two third-party evaluations had allowed model activity to extend beyond intended testing boundaries under reduced-safeguard or misconfigured conditions. Anthropic separately analyzed 832 accounts banned for malicious cyber activity: 560, or 67.3%, had used AI for malware-related preparation and 54, or 6.5%, for lateral movement. The implication is a faster attack cycle and a larger machine-identity and agent-control surface, supporting demand for continuous inspection and automated response.
-
PANW has relevant products and early commercial evidence, but investors should not convert industry news directly into revenue. Prisma AIRS customers rose from roughly 30 in fiscal Q1 to more than 300 in fiscal Q3, and management expects the product to exceed $$100 million of ARR within the next two quarters. XSIAM exceeded$$600 million of ARR, growing about 100%, while SASE ARR reached $$1.6 billion, up 36%. These are tangible adoption signals. They remain much smaller than total next-generation security ARR of$$8.13 billion, so the near-term thesis still depends on the broader platform rather than a single AI product.
-
Headline growth is excellent, but acquisitions materially inflate it. Fiscal Q3 revenue rose 31% to $$3.002 billion, NGS ARR rose 60% to$$8.13 billion, and remaining performance obligations rose 36% to $$18.4 billion. Excluding CyberArk and Chronosphere, revenue was$$2.614 billion, up 14%; NGS ARR was $$6.50 billion, up 28%; and RPO was$$16.6 billion, up 22%. Acquired businesses contributed 12.9% of quarterly revenue and 20.0% of NGS ARR. Organic NGS ARR growth is still strong, but the 60% headline rate is not an appropriate run-rate assumption.
-
Platformization is producing measurable cross-sell and retention. Palo Alto Networks reported roughly 2,280 pro forma platformized customers including identity and observability, about 110 sequential net additions, approximately 120% net revenue retention, and about 65% of NGS ARR from platformized customers. The causal chain is reproducible: a broader threat surface increases product adoption; more platforms lift customer spend and retention; higher ARR and RPO support revenue visibility; and recurring subscription economics support margins and cash flow. The company targets more than 4,000 platformizations and $20 billion of NGS ARR by FY2030, but execution against that long-duration target is already embedded in the multiple.
-
Cash generation is strong, while GAAP earnings quality is considerably weaker. Fiscal Q3 adjusted free cash flow was $$910 million, or 30.3% of revenue, and trailing-twelve-month adjusted free cash flow reached$$4.079 billion, up 34%, at a 38.5% margin. However, GAAP operating loss was $$183 million versus non-GAAP operating income of$$814 million. The $$997 million gap included$$517 million of stock-based compensation, equal to 17.2% of revenue, plus acquisition costs and amortization. Cash flow validates the business model, but recurring dilution and acquisition accounting cannot be ignored.
-
Risk/reward is unfavorable unless FY2027 organic growth materially exceeds the current trajectory. Using a roughly $$315.3 billion market capitalization and$$4.079 billion of trailing adjusted free cash flow implies approximately 77 times adjusted FCF. Using a roughly $$311.8 billion enterprise value and the$$11.42 billion midpoint of FY2026 revenue guidance implies approximately 27.3 times sales. At these levels, a merely good fiscal Q4 or a deceleration toward mid-teens organic revenue growth could cause multiple compression even if cybersecurity demand remains healthy.
2. Company Overview, Business Mix, and Core Operating Metrics
Palo Alto Networks has evolved from a next-generation firewall vendor into a multi-platform cybersecurity provider. Its operating strategy is to consolidate previously separate security budgets into integrated platforms spanning network security, cloud and AI security, security operations, identity, and observability. The February 2026 CyberArk acquisition expanded privileged-access and machine-identity capabilities, while Chronosphere added cloud-native observability. Management plans to begin reporting segment-level revenue across Network Security, Cortex, and Identity in FY2027, which should improve transparency after this period of acquisition-driven expansion.
|
Platform / business
|
Primary function
|
Key fiscal Q3 evidence
|
Economic role
|
|
Network Security
|
Hardware and software firewalls, SASE and secure access
|
SASE ARR $1.6B, +36%; software firewall ARR +25%; hardware NGFW bookings about +40%
|
Installed-base anchor and recurring subscription funnel
|
|
Cortex / Security Operations
|
XSIAM, XDR, SOC analytics and automation
|
XSIAM ARR above $600M, about +100%; more than 740 customers; over 17 PB of daily ingestion
|
Consolidates SIEM and point tools; high data and workflow switching costs
|
|
Cloud and AI Security
|
Prisma Cloud and Prisma AIRS runtime/model/application protection
|
Prisma AIRS customers above 300; expected to exceed $100M ARR within two quarters
|
Direct exposure to enterprise AI deployment and cloud workload growth
|
|
Identity
|
CyberArk privileged access, secrets and machine identity
|
More than $1.3B of NGS ARR; CyberArk ARR +27%; about 1,000 cross-organization engagements
|
Addresses the rapid growth of human and machine identities
|
|
Observability
|
Chronosphere cloud-native telemetry and application observability
|
More than $$300M ARR; over$$100M sequential net-new ARR
|
Adds telemetry context and expands developer/platform buyer access
|
The revenue mix is increasingly recurring. In fiscal Q3, subscription and support revenue was $$2.408 billion, or 80.2% of total revenue, while product revenue was$$594 million. That reduces dependence on appliance replacement cycles, although hardware remains strategically useful because it creates distribution and data advantages. No end customer represented more than 10% of FY2025 revenue, but three distributors collectively accounted for 44.2%, creating channel concentration even in a diversified customer base.
|
Fiscal Q3 2026 metric
|
Reported result
|
Organic / comparable view
|
Research interpretation
|
|
Revenue
|
$3.002B, +31%
|
$2.614B, +14% excluding acquired revenue
|
Strong execution, but 12.9% of revenue was acquired
|
|
NGS ARR
|
$8.13B, +60%
|
$6.50B, +28% excluding acquired ARR
|
Best indicator of platform momentum; headline materially acquisition-assisted
|
|
Remaining performance obligations
|
$18.4B, +36%
|
$16.6B, +22% organically
|
Supports visibility, while contract duration and acquired backlog matter
|
|
Non-GAAP operating income / margin
|
$814M / 27.1%
|
Versus $627M in prior year
|
Scale benefits remain visible despite integration costs
|
|
GAAP operating income / margin
|
$(183)M / (6.1)%
|
Versus $219M / 9.6% in prior year
|
Acquisition amortization, costs and SBC obscure statutory profitability
|
|
Adjusted free cash flow / margin
|
$910M / 30.3%
|
TTM $4.079B / 38.5%
|
High cash conversion, though adjusted definitions deserve scrutiny
|
The quarter also exceeded management's prior guidance. Revenue was approximately 2.0% above the prior midpoint, NGS ARR about 2.3% above, RPO about 2.8% above, and non-GAAP EPS of $$0.85 was 7.6% above the$$0.79 midpoint. Fiscal Q4 guidance calls for $$3.345$$3.355 billion of revenue, $$8.90$$8.95 billion of NGS ARR, $$20.9$$21.0 billion of RPO, and $$0.96$$0.98 of non-GAAP EPS. Full-year guidance centers on $$11.42 billion of revenue, a 29.05% non-GAAP operating margin,$$3.78 of non-GAAP EPS, and a 37.5% adjusted FCF margin.
3. Fundamental Quality
Palo Alto Networks' fundamental quality rests on three features: high recurring revenue, strong platform retention, and unusually high cash generation. Revenue grew from $$6.893 billion in FY2023 to$$9.222 billion in FY2025, a two-year compound rate of about 15.7%. Subscription and support revenue rose from $$5.314 billion to$$7.420 billion over the same period and reached more than 80% of the mix. GAAP operating margin expanded from 5.6% to 13.5% before the recent acquisition-related reset, while free cash flow remained near 38% of revenue.
|
Fiscal year
|
Revenue
|
YoY growth
|
GAAP operating margin
|
Operating cash flow
|
Free cash flow
|
FCF margin
|
|
FY2023
|
$6.893B
|
25.3%
|
5.6%
|
$2.778B
|
$2.631B
|
38.2%
|
|
FY2024
|
$8.028B
|
16.5%
|
8.5%
|
$3.258B
|
$3.101B
|
38.6%
|
|
FY2025
|
$9.222B
|
14.9%
|
13.5%
|
$3.716B
|
$3.470B
|
37.6%
|
|
TTM through Q3 FY2026
|
Not directly comparable after acquisitions
|
—
|
GAAP distorted by integration
|
—
|
$4.079B adjusted
|
38.5% adjusted
|
The quality of growth is best evaluated through organic NGS ARR, RPO, platformization and retention rather than reported revenue alone. Approximately 65% of NGS ARR now comes from platformized customers, implying roughly $$5.3 billion of ARR connected to multi-platform relationships. Customers with more than$$10 million of NGS ARR increased 49% to 67, and those above $5 million increased 51% to 195. These figures support the consolidation thesis: large enterprises are willing to concentrate more security spend with PANW, and 120% net revenue retention among platformized customers implies expansion after initial adoption.
The AI-security revenue chain is plausible but must be monitored stage by stage. OpenAI's evaluation incidents demonstrate why internet egress, isolation, identity restrictions, monitoring and stop conditions matter for autonomous agents. Anthropic's evidence of AI-assisted malware and lateral movement supports faster telemetry analysis and automated containment. PANW can monetize those needs through Prisma AIRS, CyberArk, XSIAM, SASE and network controls. Commercial proof would appear first in customer counts, ARR and large-platform deals, then in organic RPO, revenue and ultimately cash flow. Today, the early KPIs are strong; the final link to incremental consolidated revenue has not yet been isolated.
Balance-sheet capacity is substantial but acquisition exposure has increased. At April 30, cash and investments totaled about $$6.99 billion against$$1.35 billion of convertible notes, leaving roughly $$5.64 billion of net cash and investments. Conversely, goodwill of$$21.90 billion and intangible assets of $7.28 billion together represented about 63% of total assets. This concentration raises impairment and integration risk if acquired growth disappoints. It also explains part of the GAAP/non-GAAP divergence.
Valuation is the main fundamental constraint. The $$383.80 reference price divided by FY2026 guided non-GAAP EPS of$$3.78 produces a 101.5-times multiple. The roughly $315.3 billion market capitalization divided by trailing adjusted FCF produces a 77.3-times multiple and a 1.3% yield. Even assuming a premium for recurring revenue and category leadership, this valuation requires elevated organic NGS ARR growth, durable high-30s cash margins and successful integration for several years. A strong company can still be a poor risk/reward when the share price discounts an unusually narrow range of favorable outcomes.
4. Industry and Competitive Landscape
The most important recent industry development is not simply that generative AI can write malicious code; it is that increasingly autonomous models can chain actions, use tools and interact with external systems. OpenAI's August 7 statement that it could not rule out Critical cyber capability in an upcoming model raises the potential ceiling of automated exploitation. Its August 4 evaluation disclosure showed that configuration errors, reduced safeguards and ambiguous authorization boundaries can allow agents to act beyond intended scope. Anthropic's year-long sample found AI use moving deeper into the attack chain and medium-or-higher-risk actors increasing from 33% of the first half of its observation period to 56% in the second half. These are direct observations from model providers, not forecasts from security vendors.
|
Recent evidence
|
Required enterprise control
|
PANW exposure
|
Measurable commercial signal
|
Research implication
|
|
OpenAI could not rule out Critical cyber capability
|
Zero-trust access, network isolation, continuous detection
|
NGFW, SASE, XSIAM
|
SASE ARR +36%; XSIAM ARR about +100%
|
Positive demand signal, not proof of market-share capture
|
|
Model activity exceeded intended evaluation boundaries
|
Egress control, sandboxing, identity and stop conditions
|
SASE, CyberArk, Prisma AIRS
|
CyberArk ARR +27%; AIRS customers above 300
|
PANW's multi-control architecture is relevant to agent governance
|
|
67.3% of Anthropic's studied malicious accounts used AI for malware preparation
|
Faster detection engineering and automated SOC response
|
Cortex XSIAM and XDR
|
More than 740 XSIAM customers; 17+ PB daily ingestion
|
Data scale and automation become more valuable as attack speed rises
|
|
6.5% used AI in lateral movement and risk shifted toward more capable actors
|
Identity segmentation and east-west visibility
|
CyberArk plus network security
|
About 1,000 cross-organization identity engagements
|
Identity integration can broaden wallet share if execution succeeds
|
|
Attack chains becoming more autonomous
|
Consolidated telemetry and policy across domains
|
Full platformization strategy
|
About 2,280 pro forma platformizations; about 120% NRR
|
Favors broad platforms, but creates integration complexity
|
Competition remains intense because the same demand catalyst benefits multiple vendors. CrowdStrike leads in endpoint telemetry and cloud-delivered detection, Zscaler specializes in zero-trust access and SASE, and Fortinet combines efficient hardware with secure networking. PANW has the broadest current platform scope, but its 14% organic quarterly revenue growth trails the latest reported growth rates of these peers. Cross-company definitions and fiscal periods differ, so the comparison is directional rather than perfectly standardized.
|
Company / latest quarter
|
Revenue growth
|
Recurring / demand KPI
|
Profitability / cash metric
|
Relative position
|
|
Palo Alto Networks, Q3 FY2026
|
+31% reported; +14% organic
|
Organic NGS ARR +28%; organic RPO +22%
|
27.1% non-GAAP operating margin; 30.3% adjusted FCF margin
|
Broadest platform and acquisition-led scale; organic top-line laggard in this set
|
|
CrowdStrike, Q1 FY2027
|
+26%
|
ARR $5.51B, +24%; net-new ARR +32%
|
23.4% non-GAAP operating margin; 33.7% FCF margin
|
Organic growth winner in endpoint and SOC; direct XSIAM competitor
|
|
Zscaler, Q3 FY2026
|
+25%
|
ARR $3.525B, +25%; about +21% organic
|
23% non-GAAP operating margin; 16% quarterly FCF margin
|
Focused SASE winner; cash-margin laggard versus PANW and peers
|
|
Fortinet, Q2 2026
|
+26%
|
Billings $2.372B, +33%; product revenue +52%
|
33.7% GAAP operating margin; 47.2% FCF margin
|
Secure-networking and statutory-margin winner; benefits from appliance refresh
|
PANW's strategic advantage is its ability to bundle controls across network, cloud, SOC and identity while using a common sales relationship. Its disadvantage is that broad coverage requires consistent product quality across categories where focused competitors remain strong. CrowdStrike is the cleaner organic growth benchmark, Fortinet currently has superior GAAP profitability, and Zscaler retains specialist credibility in zero trust. Fragmented point-solution vendors are the clearest structural losers if platform consolidation continues, while PANW would become a relative loser if acquisitions mask sustained mid-teens organic revenue growth or if integration reduces innovation speed.
5. Key Risks
-
Valuation compression. Trigger: organic revenue remains near 14% or NGS ARR growth falls below 25% while the stock retains a triple-digit guided earnings multiple. Pathway: lower duration expectations raise the discount rate applied to future cash flows, compressing the sales and FCF multiples even if revenue still grows.
-
Acquisition integration and accounting risk. Trigger: CyberArk or Chronosphere ARR growth slows, cross-sell engagements fail to convert, or restructuring and amortization remain elevated. Pathway: acquired growth fails to offset purchase consideration, goodwill impairment risk rises, and the GAAP/non-GAAP earnings gap remains unusually wide.
-
Stock-based compensation and dilution. Trigger: quarterly SBC remains around or above 15% of revenue; fiscal Q3 was 17.2%. Pathway: reported free cash flow overstates per-share economic accretion because employees receive a larger ownership claim, weakening the value of buybacks or cash generation to existing holders.
-
Platform execution risk. Trigger: platformization net additions fall below roughly 100 per quarter, platformized NRR drops below 115%, or the FY2030 trajectory toward more than 4,000 customers slips. Pathway: customers retain best-of-breed tools, cross-sell slows, and the strategic rationale for PANW's premium versus focused vendors weakens.
-
Competitive displacement. Trigger: CrowdStrike, Zscaler or Fortinet sustains materially faster organic growth while PANW discounting increases. Pathway: product or pricing pressure reduces win rates and gross margin, requiring higher sales investment to defend share.
-
AI security monetization risk. Trigger: Prisma AIRS does not exceed $100 million of ARR within management's stated two-quarter horizon or AI-security customer growth slows sharply. Pathway: model-provider security news proves real but budget accrues to cloud platforms, internal tools or competitors rather than PANW.
-
Channel and contract-quality risk. Trigger: disruption at the three distributors that represented 44.2% of FY2025 revenue, shorter contract duration, or slower conversion of RPO. Pathway: billings and cash collection weaken before recognized revenue fully reflects the change.
-
Security-product or reputational failure. Trigger: a material vulnerability, outage or breach involving PANW products or acquired platforms. Pathway: remediation expense and reputational damage slow consolidation wins precisely when customers require higher trust from strategic vendors.
6. Monitoring Checklist
-
Organic NGS ARR growth: maintain at least 25%; a decline below 22% would weaken the category-dominance thesis.
-
Organic revenue growth: accelerate from fiscal Q3's 14% toward the high teens as acquired comparisons normalize; another quarter near or below 14% would highlight the gap between narrative and consolidated monetization.
-
Platformization: at least 100 net additions per quarter and NRR at or above 115%; both metrics test whether consolidation is deepening.
-
Prisma AIRS: exceed $100 million of ARR within the next two reported quarters and continue customer growth from the fiscal Q3 base of more than 300.
-
XSIAM and CyberArk: XSIAM ARR growth above 50%, continued expansion from more than 740 customers, and CyberArk ARR growth at or above 20%.
-
Cash quality: adjusted FCF margin at or above 35% on a trailing basis, while SBC falls below 15% of revenue and the GAAP/non-GAAP operating-income gap narrows.
-
Acquisition balance sheet: goodwill plus intangibles as a share of assets, integration charges, and any impairment indicators; current concentration is approximately 63%.
-
Valuation: at the current FY2026 guide, a price below roughly $285 would still represent about 75 times non-GAAP EPS; without upward estimate revisions, valuation risk remains elevated even after a substantial correction.
The next fiscal Q4 release is the immediate verification point because it will test 8.90-8.95 billion of NGS ARR, 20.9-21.0 billion of RPO, and the conversion of acquisition-assisted growth into cash and organic momentum. The highest-information outcome is not another headline beat; it is clear FY2027 disclosure separating Network Security, Cortex and Identity and showing that organic growth remains durable after acquired contributions are normalized.
7. Sources