Author: LBank Research Analyst: Ludo
Disclaimer: This report is compiled and analyzed from publicly available information and is intended solely for information sharing and research discussion. It does not constitute investment advice, a securities recommendation, a trading instruction, or any guarantee of returns. The company operations, valuations, market prices, and consensus expectations discussed herein may change over time. Readers should independently verify the data and make their own decisions.
1. Core Conclusion
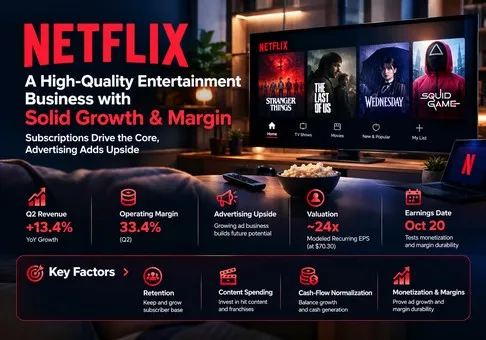
Overall judgment: Netflix is a high-quality recurring entertainment business; at the October 9 stock close of USD 70.30, valuation is reasonable rather than clearly undervalued, with a modestly positive risk/reward bias. The decisive variable is monetization growth without damage to retention or cash content efficiency.
-
Profitability remains a competitive advantage. The latest quarter combines 13.4% revenue growth with a 33.4% operating margin. That supports a premium to weaker video platforms, but the slight year-over-year margin decline cautions against assuming effortless operating leverage.
-
The advertising opportunity is material but still supplementary. The annual advertising forecast is about 5.9% of the revenue midpoint. Even a doubling therefore leaves subscription economics central to the investment case. Better ad yield and incremental customers matter more than a dramatic growth percentage from a small base.
-
Reported cash flow overstates recurring earning power this year. Management's USD 12.5 bn FCF outlook includes the merger termination receipt. Our mechanical fee-adjusted sensitivity is USD 9.7–10.3 bn before any separate adjustment for unusual taxes. At a USD 299.5 bn diluted-share equity-value proxy, that implies approximately 29–31x cash flow, rather than the headline 24x.
-
The price reset creates room for execution, not proof of mispricing. A research model using management's revenue midpoint and margin outlook, an assumed USD 0.5 bn annual net non-operating expense, a 20% tax rate and 4.261 bn diluted shares produces recurring EPS of about USD 2.93. The stock is about 24x that estimate. This is our model, not guidance or analyst consensus.
-
The next catalyst must resolve revenue quality. October 20 earnings should test the company's USD 12.860 bn revenue and 33.2% operating-margin Q3 internal forecast; the October 9 workforce report adds a cost question. Layoffs alone would not justify a higher earnings multiple. A positive outcome would combine sustained monetization, maintained service quality and a credible recurring cash-flow bridge.
The valuation calculation uses the October 9 regular-session NASDAQ stock price and the latest reported quarterly diluted weighted-average share count. USD 70.30 × 4.261 bn = USD 299.548 bn is a transparent valuation proxy, not a verified current market capitalization. The denominator is kept constant in every scenario; subsequent repurchases, issuance and changes in dilution can change actual per-share outcomes. NFLXON is a separate tokenized instrument and its displayed token price is excluded.
Our operating sensitivity starts with USD 51.2 bn × 31.5% = USD 16.128 bn of 2026 operating profit. Subtracting the assumed USD 0.5 bn net non-operating expense and applying 20% tax gives USD 12.502 bn recurring net income, or USD 2.934 per diluted share. A 24x illustrative multiple yields USD 70.42, close to the observed stock price. This anchors the fair-value judgment without treating first-quarter transaction income as repeatable.
For a 2027 sensitivity, revenue growth of 12% and a 32.5% margin yield USD 18.637 bn operating profit and USD 3.405 EPS using the same financing, tax and share assumptions. At 24x, the illustrative value is USD 81.72, approximately 16.2% above the reference price. A slower 6% growth path with a 30% margin yields USD 2.963 EPS; at 20x, USD 59.26 is approximately 15.7% below it. These are conditional research sensitivities, not price targets, probabilities or management forecasts. The positive bias comes from the base operating path, while the current-year earnings calculation supports a fair valuation classification.
2. Company Overview, Business Mix, and Core Operating Metrics
Netflix, Inc. sells access to a global entertainment service. Monthly subscriptions create recurring revenue, while advertising on eligible plans supplements subscription receipts. Original and licensed programming attracts customers, reduces cancellations and enables pricing.
Distribution, recommendation technology and a shared content library allow one investment to serve multiple countries, although localization, rights and customer preferences prevent a uniform global product.
The company reports one operating segment. Regions are revenue disclosures, not independently valued profit centers. Advertising is embedded in consolidated revenue and is not a separately disclosed quarterly business with a public margin. Gaming, live programming and adjacent experiences should be assessed as tools for acquisition, retention and monetization until separate financial evidence supports another treatment. Assigning large independent valuations to these activities would count benefits twice if those benefits already sit in subscription growth.
|
Business / region
|
Q2 2026 revenue, USD bn
|
Revenue share
|
Economic role
|
|
UCAN
|
5.432
|
43.2%
|
Subscription and advertising; largest regional revenue base
|
|
EMEA
|
4.034
|
32.1%
|
Subscription and advertising; broad localization opportunity
|
|
LATAM
|
1.584
|
12.6%
|
Subscription and advertising; affordability and FX sensitivity
|
|
APAC
|
1.510
|
12.0%
|
Subscription and advertising; diverse pricing and content markets
|
|
Advertising, global
|
Not separately disclosed for Q2
|
Included above
|
2026 management forecast: approximately USD 3 bn; not an additional segment
|
Regional figures are rounded from the June 30 Form 10-Q; shares use consolidated revenue as denominator and may not sum exactly because of rounding. No regional operating-profit split is inferred. Advertising revenue is already included in the regions.
Core operating metrics and changes
|
Indicator
|
Latest reading / forecast
|
Research interpretation
|
|
Q2 revenue growth
|
13.4%; 12% FX-neutral
|
Broad growth; pricing and ads must support durable retention
|
|
Q3 internal forecast
|
USD 12.860 bn; 33.2% operating margin
|
An earnings hurdle, not a reported Q3 result or consensus
|
|
2026 management outlook
|
USD 51.0–51.4 bn; 31.5% operating margin
|
Model uses USD 51.2 bn midpoint
|
|
Cash-content discipline
|
Approximately 1.1x spend / amortization, 2026 forecast
|
Operating margin must be tested against cash investment
|
|
Next earnings interview
|
2026-10-20
|
Primary near-term catalyst
|
|
Workforce report
|
Approximately 5%; Reuters/Puck, October 9; unconfirmed
|
No savings or restructuring charge assumed
|
The business driver chain is: more useful entertainment and better discovery → retained paid relationships and sustainable pricing → recurring revenue → operating profit after content amortization → cash flow after actual content payments and taxes → equity value. Advertising adds a second chain through audience availability, sell-through and yield. A larger ad-supported audience does not automatically produce better economics if subscribers downgrade from more profitable plans or if ad delivery costs rise.
A reproducible advertising sensitivity illustrates the point. Starting from the USD 3 bn annual advertising forecast, assume 20% growth in monetizable audience and 10% growth in realized revenue per audience unit. Revenue would be USD 3 bn × 1.20 × 1.10 = USD 3.96 bn, an incremental USD 0.96 bn. At an explicitly assumed 40% incremental operating margin and 20% tax rate, incremental earnings would be USD 0.307 bn, or USD 0.072 per diluted share. At 24x earnings, the arithmetic contribution is USD 1.73 per share. This isolates one driver; it is not added again to the full-company 2027 scenario, where advertising is already included in revenue growth.
The model shows why retention is the first constraint. A monetization plan that increases revenue per household while causing more cancellations can lose future subscription receipts and advertising inventory at the same time. Conversely, an attractive entry plan can expand the addressable customer base. Public disclosures do not support an exact decomposition of current revenue growth into customer numbers, pricing and advertising; no missing subscriber or ARPU series is fabricated.
3. Fundamental Quality
|
Metric
|
Q2 2025
|
Q2 2026
|
Meaning
|
|
Revenue, USD bn
|
11.079
|
12.560
|
Growth supports scale
|
|
Operating margin
|
34.1%
|
33.4%
|
Content timing matters
|
|
Net income, USD bn
|
3.125
|
3.401
|
GAAP; growth below revenue
|
|
Diluted EPS, USD
|
0.72
|
0.80
|
Split-adjusted
|
|
Operating cash flow, USD bn
|
2.423
|
1.744
|
Cash taxes and timing constrain conversion
|
|
Capital expenditure, USD bn
|
0.156
|
0.219
|
Property/equipment; excludes content spending
|
|
FCF, USD bn
|
2.267
|
1.525
|
OCF less property/equipment purchases; non-GAAP
|
|
Cash and equivalents, USD bn
|
9.034 at December 31, 2025
|
9.099
|
Balance-sheet comparison uses year-end baseline
|
|
Debt carrying value, USD bn
|
14.463 at December 31, 2025
|
14.309
|
Gross principal approximately USD 14.4 bn
|
Income and cash-flow comparisons use the June quarters; balance-sheet baselines are explicitly December 31, 2025. Amounts are rounded. Capital expenditure is calculated as OCF minus FCF from the company's reconciliation. Content payments are already in OCF and must not be subtracted a second time. EPS reflects the November 2025 ten-for-one split.
Growth quality is strong; cash conversion requires normalization. A recurring monthly billing relationship offers more visibility than individual theatrical releases. Geographic diversification makes the revenue base less dependent on one slate or one local economy, but it does not eliminate pricing pressure. The appropriate quality test is whether renewal behavior and cash economics survive higher monetization. Revenue can grow while the underlying customer proposition weakens, so a financial result should be evaluated alongside retention-sensitive evidence.
Margin quality is strong but exposed to content accounting. Content amortization affects operating profit, while cash production and licensing payments follow their own schedules. A low equipment-capex number does not mean Netflix can maintain its service without substantial reinvestment. The economic equivalent of maintaining productive capacity includes replenishing the library. Growing accounting profit while cash spending accelerates would reduce the value of each reported earnings dollar.
The quarterly FCF decline is a reason to investigate conversion, not sufficient evidence of a broken business. Timing of taxes, production and payments can move quarterly cash flow sharply. At the same time, favorable first-half cash numbers must not be extrapolated mechanically: the USD 2.8 bn termination fee is a one-time receipt recorded below operating income and included in operating cash flow. Excluding the fee is analytically different from excluding an operating investment required to keep subscribers.
Our conservative cash sensitivity subtracts the entire USD 2.8 bn receipt from the USD 12.5 bn outlook, giving USD 9.7 bn. A separate assumed 20% cash tax on that receipt gives an after-tax benefit of USD 2.24 bn and an adjusted USD 10.26 bn. The company has not provided a precise recurring FCF bridge in these terms. Actual tax timing and other non-routine payments can alter the result; the range is a research normalization sensitivity, not a company metric. The corresponding proxy cash-flow yields are 3.2% and 3.4%. The unadjusted outlook gives 4.2%, explaining why the headline figure can make the stock look cheaper than its continuing economics warrant.
Balance-sheet quality is adequate to strong. The gap between gross debt and cash is manageable relative to modeled annual operating profit. That supports financial flexibility, but cash is also needed for content commitments, acquisitions and refinancing. Valuation should not treat every balance-sheet dollar as immediately distributable. In addition, the equity earnings model includes a net financing assumption; subtracting net debt again from that equity earnings valuation would mix enterprise and equity approaches.
Capital allocation should improve per-share economics only when repurchases are disciplined. Buying back shares below durable value transfers more future earnings to continuing holders. A large authorization, however, is permission to spend rather than proof of attractive returns. Our model holds shares constant to avoid assuming future buybacks improve EPS automatically. The board's choices should be judged by the cash remaining after funding programming and by the economic value received for acquisitions.
The single most important variable is retention-adjusted monetization: incremental pricing and ad revenue after the losses from churn, plan migration and content reinvestment. This measure connects the product directly to earning power. An improvement that survives all those deductions would strengthen the premium valuation; margin expansion driven only by deferring investment would not.
4. Industry and Competitive Landscape
The relevant industry is paid and advertising-supported video entertainment, within a broader competition for consumer time. Its value chain runs from creative talent and rights holders through production and distribution to billing and advertising demand. A subscription service competes for household budgets, while its advertising tier also competes for marketers' attention and measurable outcomes. These markets overlap, but they are not interchangeable measures of market share.
|
Competitive layer
|
Observable scale / position
|
Winners and pressure points
|
Valuation implication
|
|
Paid premium video
|
Netflix Q2 revenue USD 12.560 bn; Disney SVOD margin 12.9%
|
Netflix leads this peer set in disclosed video operating profitability; Disney is improving
|
Premium justified by recurring economics, not title count
|
|
Advertising and attention
|
YouTube Q2 ads USD 11.055 bn; no stand-alone operating margin
|
YouTube wins ad scale; Netflix has a smaller monetization runway
|
Do not capitalize every ad dollar as pure profit
|
|
Premium franchises
|
WBD Streaming above USD 3 bn revenue, USD 512 mn Adjusted EBITDA
|
HBO Max strengthens premium-content competition
|
Content bidding can absorb scale benefits
|
|
Legacy distribution
|
Structural contrast: cable bundles versus on-demand distribution
|
Legacy linear distribution is the structural loser in our framework; Netflix a net beneficiary
|
Industry migration does not guarantee shareholder return at any price
|
The scale metrics above describe distinct revenue pools. They are not a global streaming market-share estimate. The conclusion about legacy distribution is a structural research inference, not a claimed current percentage loss for an individual company.
|
Company / comparable unit
|
Period
|
Revenue / growth
|
Profitability
|
Comparability
|
|
Netflix, Inc.
|
Q2 2026
|
USD 12.560 bn; +13.4%
|
33.4% GAAP operating margin
|
Consolidated streaming business
|
|
The Walt Disney Company / Entertainment SVOD
|
Q3 FY2026, June 27
|
Revenue +11%; USD 5.519 bn implied by rounded margin
|
USD 712 mn operating income; 12.9%
|
SVOD non-GAAP; excludes Hulu Live TV/Fubo; revenue approximation
|
|
Warner Bros. Discovery, Inc. / Streaming
|
Q2 2026
|
Above USD 3 bn; distribution +11% ex-FX
|
USD 512 mn Adjusted EBITDA; nearly 17%
|
EBITDA differs from operating profit; distribution growth is not total growth
|
|
Alphabet Inc. / YouTube ads
|
Q2 2026
|
USD 11.055 bn; +13%
|
YouTube margin undisclosed; Alphabet consolidated 34%
|
Ads only; excludes YouTube subscriptions; parent margin not proxy
|
Disney revenue approximation is USD 0.712 bn / 12.9% = USD 5.519 bn; rounding prevents treating it as the exact reported revenue. WBD's nearly 17% metric is Adjusted EBITDA margin, not GAAP operating margin. YouTube advertising revenue excludes subscription receipts; Alphabet's consolidated margin is shown solely to explain the parent disclosure boundary. Different units and accounting measures preclude a direct ranking of all four margins.
Netflix is the net beneficiary of the shift toward on-demand entertainment in our framework. Its recurring distribution base can spread a successful title over a broad audience and produce cash without maintaining a legacy network infrastructure. That supports the durability of its operating model. It does not mean every additional streaming competitor loses: customers can purchase multiple services, and an improved rival can expand the market while putting pressure on Netflix's pricing power.
Disney is a profitability improver in the subscription peer set, and its franchises provide a different acquisition and retention proposition. WBD's HBO Max strengthens the premium-content contest. YouTube is the advertising-scale winner among the disclosed video businesses here. Netflix leads the disclosed operating profitability of the subscription units, while legacy linear distribution is the structural losing model. These judgments distinguish operating position from stock performance; no unsupported claim is made that a rival's equity is unattractive.
The most consequential competitive pressure is the option to spend time without buying another premium subscription. This can limit pricing even when Netflix's immediate video competitors have lower margins. In advertising, a buyer can redirect budgets toward platforms with better measurement or cheaper inventory. Netflix must demonstrate a differentiated audience proposition and economic yield, rather than relying on the attractiveness of television advertising in general.
Industry consolidation also has two possible transmission paths. Fewer suppliers can increase content rights prices; a stronger combined rival can increase competition for households. Netflix's decision not to proceed with the WBD transaction avoids the integration costs of that particular combination, but it does not remove competitive pressure from another buyer. The research case therefore favors continued organic execution rather than assigning value to speculative acquisition opportunities.
5. Key Risks
-
Pricing damages retention. Revenue growth below 10% alongside weak engagement or adverse renewal commentary would suggest price increases are exhausting customer willingness to pay. Lost customers reduce subscription revenue and available ad inventory, weakening earnings and the justified multiple together.
-
Advertising cannibalizes subscriptions. A larger advertising audience with weak yield or heavy downgrading can replace high-value subscriptions with lower total revenue. Falling revenue per paid relationship would undermine the ad sensitivity even if reported ad growth remains impressive.
-
Content investment outruns monetization. A cash-spend/amortization ratio persistently above 1.2x, without faster revenue growth, would indicate that accounting margins are not translating into recurring cash returns. The cash-flow multiple would rise as distributable cash falls.
-
Transaction cash distorts valuation. Treating the termination receipt as recurring could overstate the earnings base and support an unjustified re-rating. Unfavorable cash-tax timing or other non-routine payments could also make our normalization range inaccurate. The risk is an analytical overestimate of sustainable yield, not reversal of a receipt already recorded.
-
Restructuring disrupts execution. If the reported workforce plan is confirmed, severance and lost capabilities could precede savings. Damage to content decisions, advertising operations or product delivery would weaken the revenue engine. The report incorporates no quantified cost benefit before company disclosure.
-
Competitors raise acquisition and rights costs. More effective rival bundles or aggressive content bidding can force spending increases while limiting pricing. A service can retain viewers yet produce a lower return on each content dollar, compressing both FCF and valuation.
-
FX and the valuation multiple move adversely. Currency weakness can reduce translated revenue, while a higher required equity return lowers the multiple investors accept. Our slower-growth sensitivity illustrates the combination of weaker earnings and a 20x multiple; a lower multiple could create further downside even with stable operations.
6. Monitoring Checklist
-
October 20 Q3 results: compare revenue with USD 12.860 bn and operating margin with 33.2%, the existing internal forecast. Meeting both supports the base case; a miss accompanied by weaker forward guidance would undermine it.
-
2026 outlook: maintaining at least USD 51.0 bn revenue and 31.5% operating margin supports current-year earning power. A cut caused by churn or advertising weakness matters more than timing alone.
-
Advertising: retain the approximately USD 3 bn 2026 trajectory, while seeking evidence of yield and total customer monetization. A shortfall or cannibalization weakens the incremental earnings bridge.
-
Cash content investment: approximately 1.1x cash spending to amortization supports conversion. Persistently above 1.2x without matching growth would reduce confidence in recurring FCF.
-
FCF reconciliation: seek a company bridge separating the termination receipt, cash taxes and other unusual payments. Recurring cash around or above the research USD 9.7–10.3 bn range supports the valuation; a materially lower comparable result would challenge it.
-
Retention and engagement: any comparable evidence of falling consumption or pricing-related cancellations weakens monetization durability. Do not equate absence of a quarterly subscriber disclosure with zero customer growth or assume total hours alone determines value.
-
Capital allocation and restructuring: review confirmed charges, savings, share dilution and content commitments. A lower share count with stable recurring cash can improve EPS; reduced headcount without sustained revenue does not establish value creation.
These thresholds are research signposts, not management commitments beyond the explicitly identified guidance. The financial reference period is Q2 2026; Q3 results have not yet been released as of the report date. No real-time consensus series or third-party target-price aggregation is used. Estimated taxes, financing costs, share denominator and selected multiples are disclosed assumptions and materially affect valuation. The workforce plan remains a secondary-source report, not a confirmed company action.
7. Sources
-
-
NFLXON/USDT Spot Trading | LBank (https://www.lbank.com/trade/nflxon_usdt) — 2026-10-10; Safari-rendered pair, Stocks tag, token identity, chart and order controls verified; token quote not used for stock valuation.
-
Q2 2026 Letter to Shareholders (https://s22.q4cdn.com/959853165/files/doc_financials/2026/q2/FINAL-Q2-26-Shareholder-Letter.pdf) — 2026-07-16; Q2 actuals and management forecasts.
-
-
Netflix Investor Events (https://ir.netflix.net/investor-news-and-events/investor-events/default.aspx?ShowNotify=175786) — checked 2026-10-10; Q3 interview scheduled for October 20.
-
Netflix (NFLX) Stock Price History (https://stockanalysis.com/stocks/nflx/history/) — 2026-10-09 regular-session close; secondary market-data distributor, S&P Global attribution.
-
-
-
-