Author: LBank Research Analyst: Ludo
Disclaimer: This report is compiled and analyzed from publicly available information and is intended solely for information sharing and research discussion. It does not constitute investment advice, a securities recommendation, a trading instruction, or any guarantee of returns. The company operations, valuations, market prices, and consensus expectations discussed herein may change over time. Readers should independently verify the data and make their own decisions.
1. Core Conclusion
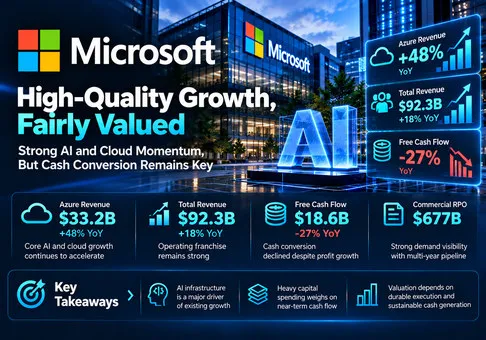
Overall judgment: Microsoft is a high-quality growth company and a net beneficiary of enterprise AI adoption, but the equity looks broadly fairly valued, with a cautious risk/reward tilt at the October 28 pre-results close of USD 531.01. The decisive variable is cash earned after infrastructure investment and lease payments.
-
The operating franchise is strengthening. Quarterly revenue reached USD 92.279 billion, with Azure contributing about 74% of the absolute year-over-year revenue increase. The investment implication is that AI infrastructure is already material to consolidated growth; a valuation argument built only on future optionality understates the current business.
-
Profit growth overstates the improvement in distributable cash. Simple FCF fell 27.4% to USD 18.633 billion even as operating income rose 21%. Cash capital spending more than doubled. This supports an earnings premium for the franchise, but provides little support for treating every incremental accounting profit as cash available to shareholders.
-
Demand visibility is strong but more concentrated than the headline implies. Commercial RPO is USD 677 billion; bookings declined 12% against a difficult comparison. OpenAI-related commercial revenue was USD 10.0 billion, approximately 10.8% of total revenue. Customer funding and collection quality therefore belong in the growth assessment. That related-party amount is not disclosed as a pure Azure revenue component.
-
The current price already requires durable execution. A mechanical trailing GAAP EPS bridge gives USD 19.15 and 27.7x earnings. Our independent FY2027 base scenario uses revenue of USD 390 billion, a 48% operating margin, a 20% tax rate, zero net non-operating income and 7.446 billion diluted shares: EPS is USD 20.11. Applying an assumed 26–28x multiple implies USD 522.93–563.16, or -1.5% to +6.1% before dividends. These are scenario assumptions, not management guidance, consensus or a formal target price. The multiple range reflects strong growth tempered by heavy reinvestment; it is a judgment, not a peer-derived statistic.
-
The downside case has a clear mechanism. Revenue of USD 375 billion, a 45% margin and 25x EPS, with the same tax and share assumptions, imply USD 453.26, or -14.6%. A stronger USD 410 billion revenue/49% margin/32x case implies USD 690.71, or +30.1%. The upside needs both earnings delivery and a higher multiple. Our base case does not assume that combination, making cash conversion more useful than an isolated earnings beat for deciding whether the valuation is attractive.
The research cutoff is the morning of October 29 in Asia/Shanghai, after Microsoft's October 28 release and before the next U.S. regular session. The price reference precedes the results; it must not be read as the price at which investors could transact after publication. Every USD 10 change in the equity price moves the base EPS multiple by approximately 0.50x.
Microsoft was selected from opened MSFTON, METAON and AMDON LBank spot interfaces. Its last coverage was July 30, 91 calendar days earlier; Meta also cleared the exclusion period, while AMD did not. Microsoft's new results provided the freshest catalyst. MSFTON is an Ondo tokenized exposure, with issuer, custody, trading-basis and redemption considerations separate from Microsoft common-stock economics. No LBank token quote is used in the equity valuation.
2. Company Overview, Business Mix, and Core Operating Metrics
Microsoft monetizes enterprise software, cloud consumption, subscriptions, licensing, advertising, games and devices. Its economic advantage is the ability to sell infrastructure and applications into existing customer relationships. The same account can purchase Azure capacity, Microsoft 365, security and business applications. This can lower distribution friction and increase switching costs, but does not make every AI workload profitable: usage revenue must exceed compute, depreciation, power and support costs.
The FY2027 presentation has two reportable segments. Agents and Infra generated USD 76.795 billion of revenue and USD 40.558 billion of operating income; Devices and Consumer generated USD 15.484 billion and USD 5.357 billion respectively. Calculated margins are 52.8% and 34.6%. Agents and Infra supplies 88.3% of operating profit. These are management segment economics, not standalone Azure margins.
Table 1. Product and service mix
|
Product/service offering
|
FY27 Q1 revenue, USD bn
|
YoY growth, calculated
|
Economics and constraints
|
|
Azure
|
33.165
|
48.2%
|
Consumption-based cloud and AI infrastructure; utilization and compute pricing determine investment returns.
|
|
Microsoft 365 cloud
|
27.778
|
17.2%
|
Commercial and consumer subscriptions, developer and security services; paid seats, mix and AI adoption drive monetization.
|
|
Productivity and server licensing
|
8.407
|
-3.1%
|
Licensing and related offerings; cloud migration changes the timing and mix of monetization.
|
|
Search and advertising
|
6.554
|
10.3%
|
Advertising and associated offerings; revenue growth differs from the ex-TAC metric.
|
|
XBOX
|
5.379
|
-2.3%
|
Content, services and hardware; releases, subscriptions and device economics affect returns.
|
|
Industry solutions
|
5.337
|
9.1%
|
Business applications and industry/professional solutions; implementation and customer budgets constrain expansion.
|
|
Windows OEM and devices
|
3.551
|
-22.0%
|
OEM licensing and devices; exposed to PC demand and product cycles.
|
|
Frontier and support services
|
2.108
|
4.3%
|
Services and support; not a separately disclosed AI model subscription business.
|
Source basis: October 28 earnings release, product and service offerings table; growth calculated from recast prior-year amounts. These eight offerings reconcile to total revenue. They are a separate disclosure dimension from the two reportable segments; Microsoft Cloud is an overlapping metric.
Core operating metrics and changes
|
Metric
|
FY26 Q1 / prior reference
|
FY27 Q1
|
Interpretation
|
|
Microsoft Cloud revenue, USD bn
|
49.1
|
63.9
|
30% reported growth; overlaps product categories and must not be added to total revenue.
|
|
Azure growth, recast
|
40%
|
48%
|
FY26 Q4 was 42% on the recast basis; acceleration is 6 percentage points.
|
|
Microsoft Cloud gross margin
|
68%
|
66%
|
Up from 65% in FY26 Q4, but below the year-earlier margin.
|
|
Microsoft 365 commercial cloud growth
|
18%
|
17%
|
18% after normalizing the prior-year recognition benefit.
|
|
Commercial seat growth
|
7%
|
5%
|
Slower seat growth increases dependence on mix and monetization.
|
|
Commercial bookings growth
|
112%
|
-12%
|
Large contracts make comparisons volatile; not equivalent to consumption revenue.
|
|
Commercial RPO, USD bn
|
392; June 2026: 678
|
677
|
73% YoY but slightly lower sequentially; duration and conversion matter.
|
|
GAAP / OpenAI-adjusted EPS, USD
|
3.72 / 4.13
|
4.92 / 4.89
|
GAAP growth is 32%; adjusted growth is 18%.
|
Source basis: FY27 Q1 release and Investor Metrics. All quarterly comparisons are year over year unless explicitly labeled. The recast Azure measure shows 42% growth in FY26 Q4; the old release's 43% for Azure and other cloud services uses a different definition.
The useful commercial question is whether revenue per relationship improves without undermining renewals or margins. Dividing 17% commercial cloud growth by 5% ending seat growth gives a rough 11.4% implied revenue-per-seat/mix contribution: 1.17 / 1.05 - 1. This is a directional diagnostic, not reported ARPU. Revenue covers a period, seats are measured at its end, and product mix, currency and recognition timing all affect the result. It cannot isolate Copilot revenue or realized pricing.
The new reporting structure also makes historical comparison more demanding. Moving offerings across segments can change apparent segment growth without changing consolidated economics. We use recast comparisons throughout and do not splice the old three-segment history into the new two-segment series. This discipline matters particularly when attributing margin improvement to AI: a broader profitable software pool can conceal a lower-return infrastructure activity.
RPO helps establish committed demand but is not annual recurring revenue or cash. The 10-Q expects approximately 30% of commercial RPO to be recognized over the next 12 months. Multiplying 677 by 30% gives roughly USD 203.1 billion of contracted revenue recognition over that window, subject to the company's rounding and contract assumptions. This is not a total-company forecast: future bookings and usage can add revenue, while recognition and collection occur on different schedules.
3. Fundamental Quality
Growth quality and operating leverage are strong; investment intensity and cash conversion are the weaknesses. The latest consolidated gross margin is 67.8%, down from 69.0% a year earlier, while operating margin increased from 48.9% to 49.8%. Expense discipline offsets some infrastructure dilution. That is a sound operating outcome, although it is not evidence that capital productivity has already improved.
Table 3. Historical financial quality
|
Financial metric, USD bn except EPS/margin
|
FY2025
|
FY2026
|
FY27 Q1
|
|
Revenue
|
281.724
|
331.839
|
92.279
|
|
Operating income
|
128.528
|
155.237
|
45.915
|
|
Operating margin, calculated
|
45.6%
|
46.8%
|
49.8%
|
|
GAAP net income
|
101.832
|
133.749
|
36.629
|
|
GAAP diluted EPS, USD
|
13.64
|
17.95
|
4.92
|
|
Operating cash flow
|
136.162
|
182.935
|
58.000
|
|
Cash additions to property and equipment
|
64.551
|
115.948
|
39.367
|
|
Simple FCF, calculated
|
71.611
|
66.987
|
18.633
|
|
Cash, equivalents and short-term investments
|
94.565
|
76.843
|
64.509
|
|
Current and long-term borrowings, excluding leases
|
43.151
|
40.294
|
35.481
|
Source basis: Microsoft 2026 Annual Report and FY27 Q1 statements; margins and FCF calculated. FY2025 and FY2026 are full years ended June 30; FY27 Q1 is three months ended September 30, 2026. Balance-sheet values are period-end stocks, not quarterly flows. Simple FCF equals operating cash flow less cash additions to property and equipment; it is an analytical measure, not GAAP income or comprehensive cash available for distribution.
Operating cash flow grew 28.7%, but cash capex absorbed 67.9% of it. Simple FCF margin fell from 33.0% to 20.2%; FCF was only 50.9% of GAAP net income. The year-over-year decline is more informative than annualizing a seasonally strong collection quarter. The quarterly accounts-receivable cash inflow was USD 17.104 billion, reminding readers that cash receipts and consumption revenue do not arrive at identical times.
There are two additional claims on cash. First, finance-lease principal was USD 1.000 billion. Subtracting it gives USD 17.633 billion, versus USD 25.024 billion a year earlier. Operating-lease cash payments and finance-lease interest are already inside operating cash flow and should not be subtracted again. New noncash lease assets are commitments, not another current cash payment.
Second, the investing statement contains USD 12.949 billion of other net outflows. MD&A says the increase was primarily to facilitate component purchases. A conservative cash sensitivity subtracts that entire line as well: 58.000 - 39.367 - 1.000 - 12.949 = USD 4.684 billion. The comparable prior-year calculation is USD 18.815 billion. This deliberately broad measure is not standardized FCF, and some payments may shift timing rather than represent a recurring annual cost. It nevertheless explains why a simple FCF headline can overstate immediately available surplus. Acquisitions and financial investment transactions remain outside both measures.
Liquidity remains substantial, but a borrowings-only view is incomplete. Cash and short-term investments exceed borrowings by USD 29.028 billion; recognized finance and operating lease liabilities total USD 98.450 billion. Uncommenced leases of USD 364.6 billion begin over FY2027–FY2034 and have terms extending up to 20 years. This is a contractual exposure, not present-value debt due immediately, and it should not simply be deducted from equity value. Its importance is the loss of flexibility if demand disappoints.
The strongest earnings-quality improvement is that the current OpenAI investment adjustment is small. Removing its USD 0.03 EPS benefit gives USD 4.89. The prior-year adjusted comparison is USD 4.13, so underlying growth is 18%, rather than the 32% GAAP headline. Removing investment marks does not remove the separate commercial counterparty exposure.
A reproducible business-to-value transmission chain
Consider an illustrative next-12-month Azure scenario, not a forecast: annualize current quarterly revenue to USD 132.660 billion, assume 35% growth to USD 179.091 billion, and obtain incremental revenue of USD 46.431 billion. At an assumed 30% incremental operating margin and 20% tax rate, incremental after-tax operating profit is USD 11.143 billion. If half must be reinvested in incremental capex net of depreciation and working capital, incremental steady-state cash flow is USD 5.572 billion.
Capitalizing that stabilized incremental flow at an assumed 4% cash yield gives USD 139.293 billion of incremental business value, approximately 3.5% of the roughly USD 3.944 trillion equity capitalization implied by the reference price and 7.427 billion period-end shares. This is a scale illustration, not a DCF or an equity target: timing, financing, existing-business growth and overlap with expectations are not modeled. It shows why even very rapid infrastructure growth can have a modest valuation effect when reinvestment is heavy and the starting market value is large. If reinvestment consumes 75% instead of 50%, the illustrated cash contribution and value halve.
The single most important variable is cash retained per unit of additional cloud revenue after all infrastructure funding needs. Higher utilization can improve that variable; lower compute prices, accelerated equipment replacement or larger lease commitments can weaken it. Growth remains valuable only if the incremental return ultimately exceeds the capital committed to obtain it.
4. Industry and Competitive Landscape
The relevant market combines enterprise cloud infrastructure, AI platforms and workflow applications. These layers have different revenue recognition, margins and capital requirements. A subscription application may monetize distribution and customer data, while infrastructure monetizes consumed capacity. Hardware sales add another distinction: revenue can rise without creating a recurring consumption stream. Comparing providers requires attention to the unit of sale before drawing conclusions about share.
Table 4. Competitive position across the value chain
|
Value-chain arena
|
Observable scale / position
|
Who is gaining or under pressure
|
Implication for Microsoft
|
|
Cloud infrastructure
|
Azure quarterly revenue USD 33.165 bn; AWS USD 42.232 bn in an earlier quarter
|
Azure and AWS remain large scaled platforms; Google Cloud and OCI are growing faster from different bases.
|
A credible beneficiary, with no demonstrated monopoly on AI infrastructure returns.
|
|
Enterprise applications and agents
|
Microsoft 365 cloud USD 27.778 bn; commercial seat growth 5%
|
Microsoft monetizes an installed base; Google Workspace and independent agents compete for workflow budgets.
|
Distribution is an advantage, but seat growth alone cannot sustain revenue growth.
|
|
Models and compute architecture
|
Google Cloud includes TPU systems; Azure offers infrastructure and AI consumption
|
|
Lower compute costs help demand but may force lower realized prices.
|
|
Contracting, power and capacity
|
Microsoft commercial RPO USD 677 bn; OCI RPO USD 664 bn
|
Large platforms win capacity commitments; smaller undifferentiated providers face a funding disadvantage.
|
Backlog and leases must be assessed together; their nominal amounts are not directly comparable.
|
Source basis: Microsoft, Amazon, Alphabet and Oracle official results cited in Sources. Scale is disclosed company revenue or contracts, not independently measured market share. No market-share percentage is inferred from this mixed-period, mixed-product sample.
Table 5. Three direct competitors and Microsoft
|
Company / business and period end
|
Relevant quarterly revenue, USD bn
|
Reported YoY growth
|
Profitability / investment evidence
|
Comparability
|
|
Microsoft Corporation / Azure; Sep 30, 2026
|
33.165
|
48%
|
Agents and Infra margin 52.8%; Microsoft Cloud gross margin 66%.
|
Neither margin is a standalone Azure operating margin.
|
|
Amazon.com, Inc. / AWS; Jun 30, 2026
|
42.232
|
37%
|
AWS operating income USD 16.621 bn; margin 39.4%, calculated.
|
One quarter earlier; includes AWS services, not retail.
|
|
Alphabet Inc. / Google Cloud; Sep 30, 2026
|
30.709
|
103%
|
Operating income USD 11.121 bn; margin 36.2%, calculated.
|
Includes Workspace and TPU systems sales; some shared AI costs remain at Alphabet level.
|
|
Oracle Corporation / OCI; Aug 31, 2026
|
7.4
|
121%
|
Group GAAP operating margin about 35%; group quarterly FCF about negative USD 5 bn.
|
OCI margin unavailable; group figures must not be treated as OCI profitability.
|
Source basis: each company's official quarterly release; margins calculated where shown. Periods and cost allocations differ. Azure revenue excludes Microsoft 365, whereas Google Cloud includes Workspace and TPU systems. Microsoft's Cloud gross margin, AWS operating margin and Oracle group margin are different measures and cannot be ranked as equivalent unit economics.
The observable winners are Azure, Google Cloud and OCI in incremental AI demand; AWS remains a large, highly profitable platform on its latest available disclosure. Google Cloud's expansion demonstrates that Microsoft's distribution advantage does not prevent a rival from growing faster. OCI demonstrates demand for a specialized infrastructure alternative, but its group cash burn and external equity financing reveal the cost of supplying that demand. Microsoft is a net beneficiary, with a broader existing profit pool supporting investment.
The weaker positions are visible inside Microsoft: Windows OEM and devices and XBOX are contracting, while traditional productivity and server licensing is also declining. We do not label AWS a share loser using a quarter-old comparison or treat all legacy revenue migration as economic destruction. The structural losers are providers unable to differentiate applications or finance competitive infrastructure; that is a business-model inference rather than a measured share claim about a particular unreported company.
Competition can lower prices while expanding total consumption. This has two opposing effects on Microsoft: cheaper compute can stimulate Azure workloads and Copilot adoption, but it can also reduce realized revenue per unit of capacity. The net outcome depends on utilization, hardware efficiency and the application's willingness to pay. Owning a distribution channel helps capture demand, yet does not exempt the company from the infrastructure replacement cycle.
Amazon's October 29 results are the next immediate peer checkpoint. They can update the stale AWS comparison and reveal whether acceleration is broad or concentrated. Our base judgment would strengthen if Microsoft sustains superior cash conversion alongside growth; it would weaken if faster rivals retain more cash without sacrificing customer adoption. A revenue-growth leaderboard alone does not resolve that question.
5. Key Risks
-
Infrastructure returns fall below the funding burden. If cash capex stays above two-thirds of operating cash flow while cloud margins weaken, incremental sales may fail to replenish liquidity. More lease funding can defer cash outflow while increasing fixed commitments, compressing the valuation multiple before accounting earnings peak.
-
OpenAI commercial concentration becomes a collection problem. Slower funding or customer demand at this related party could delay receivable conversion and future capacity consumption. Revenue growth could remain visible before a deterioration in cash receipts; that is why receivables and contract conversion must be assessed together.
-
RPO fails to translate into near-term usage. Contract amendments, longer delivery schedules or capacity delays could push recognition beyond the expected window. High nominal backlog would then coexist with slower revenue, underutilized infrastructure and weaker returns on committed capital.
-
Application monetization cannot offset slowing seat growth. If Microsoft 365 commercial cloud growth drops below the mid-teens while seat growth remains near 5%, realized mix and pricing gains may be insufficient. Lower renewal quality or expensive AI usage can transmit the shortfall into both revenue and gross margin.
-
Pricing and technology shifts shorten asset lives. More efficient rival models or alternative accelerators could force lower selling prices or faster equipment replacement. Useful-life changes and impairments would affect earnings, while replacement capex would pressure cash even without an accounting charge.
-
Security, regulation or enterprise budget pressure interrupts cross-selling. A material outage, data incident, procurement restriction or customer spending freeze can delay deployment and raise remediation costs. The resulting growth slowdown would be particularly costly against a large fixed infrastructure commitment.
-
Reported results and the entry price diverge. A favorable operating quarter can already be priced into a post-results quote. The pre-release reference price, investment marks and segment changes can all distort simple comparisons; paying a higher multiple without stronger cash assumptions reduces the prospective return.
6. Monitoring Checklist
The following thresholds are analyst monitoring rules, not company guidance or market consensus.
-
Azure growth: sustained growth above 40% on the recast definition supports the growth thesis; below 35% for two quarters weakens it, especially if commitments keep increasing.
-
Cloud gross margin: remaining at or above 66% while revenue expands strengthens unit economics; below 64% alongside rising infrastructure spend weakens them.
-
Cash conversion: simple FCF margin recovering above 25% and cash capex falling below 60% of operating cash flow would support a more favorable valuation view. Use year-over-year and trailing comparisons to control for collection seasonality.
-
Broader infrastructure cash burden: track finance-lease principal and other investing outflows separately. A positive trend in simple FCF with no recovery in the broader cash sensitivity would be insufficient evidence of improved shareholder cash generation.
-
Microsoft 365 monetization: commercial cloud growth at least 16% with seat growth at least 5% supports the base case; growth below 14% would challenge the assumed application contribution.
-
Contract and counterparty conversion: compare RPO recognition with the approximately 30% next-12-month expectation. OpenAI receivables increasing faster than related-party revenue for two consecutive quarters would be a warning; transparent collections would reduce it.
-
Competitive and valuation checkpoints: update AWS after its October 29 call and compare like periods when available. Recalculate the base EPS multiple at the observed stock price; movement above 30x without better cash assumptions would make our cautious view stronger.
7. Sources
All sources were researched on October 29, 2026. Company releases and SEC filings provide financial facts; model margins, multiples, cash sensitivities and monitoring thresholds are LBank Research calculations and assumptions. No independently verified pre-release consensus series is used, so this report does not assign a numerical consensus beat or miss. A complete same-date Microsoft call transcript and quantitative next-quarter outlook were not independently recovered; secondary capex headlines mix calendar- and fiscal-year labels, so they are excluded. This limits assessment of forward guidance, without changing the observed quarterly cash-flow result. The base valuation is conditional on our stated assumptions.
-
Microsoft Announces First Quarter Results (https://www.microsoft.com/en-us/Investor/earnings/FY-2027-Q1/press-release-webcast) — October 28, 2026; quarter ended September 30; unaudited GAAP statements and OpenAI reconciliation.
-
FY27 Q1 - Investor Metrics (https://www.microsoft.com/en-us/investor/earnings/fy-2027-q1/metrics) — October 28, 2026; recast historical metrics, cloud margin, bookings and seat growth.
-
Microsoft Corporation Form 10-Q (https://www.sec.gov/Archives/edgar/data/789019/000119312526436133/msft-20260930.htm) — Filed October 28, 2026; Notes 1, 11, 12 and 16, related-party disclosures and MD&A; SEC submissions metadata independently checked.
-
-
Microsoft 2026 Annual Report (https://www.microsoft.com/investor/reports/ar26/index.html) — Year ended June 30, 2026; consolidated FY2025/FY2026 income, cash-flow and balance-sheet comparisons. Old segment presentation is excluded.
-
-
Microsoft Stock Price History (https://stockanalysis.com/stocks/msft/history/) — Secondary market-data source; October 28, 2026 regular-session Nasdaq close USD 531.01, before the earnings release; not a post-earnings executable price.
-
-
Amazon.com Announces Second Quarter Results (https://ir.aboutamazon.com/news-release/news-release-details/2026/Amazon-com-Announces-Second-Quarter-Results/default.aspx) — July 30, 2026; AWS quarter ended June 30. Q3 results were not yet available at the research cutoff.
-
-
Alphabet Announces Third Quarter 2026 Results (https://www.sec.gov/Archives/edgar/data/1652044/000165204426000080/googexhibit991q32026.htm) — October 28, 2026; Google Cloud includes Workspace and TPU systems sales; shared AI research costs are partly reported at Alphabet level.
-
-
-
MSFTON/USDT Spot Trading | LBank (https://www.lbank.com/trade/msfton_usdt) — Opened October 29, 2026; populated pair, quote/volume, chart and buy/sell controls. Canonical English URL discovered in the alternate-language HTML. Cached token quotes are excluded from equity valuation.
-
-
-
-
Meta Reports Third Quarter 2026 Results (https://investor.atmeta.com/investor-news/press-release-details/2026/Meta-Reports-Third-Quarter-2026-Results/default.aspx) — October 21, 2026; selection catalyst only; Microsoft had the more recent reporting trigger.
-
AMDON/USDT Spot Trading | LBank (https://www.lbank.com/trade/amdon_usdt) — Opened October 29, 2026; populated spot interface; underlying AMD covered August 5, within 90 days.
-



 Transfer