Author: LBank Research Analyst: Ludo
Disclaimer: This report is compiled and analyzed from publicly available information and is intended solely for information sharing and research discussion. It does not constitute investment advice, a securities recommendation, a trading instruction, or any guarantee of returns. The company operations, valuations, market prices, and consensus expectations discussed herein may change over time. Readers should independently verify the data and make their own decisions.
1. Core Conclusion
Overall judgment: Meta has a high-quality advertising franchise and is a net operating beneficiary of AI, but the equity is fairly valued to demanding rather than clearly undervalued at USD 624.52. Risk/reward is cautious because the decisive variable is cash generation per share after infrastructure investment and financing.
-
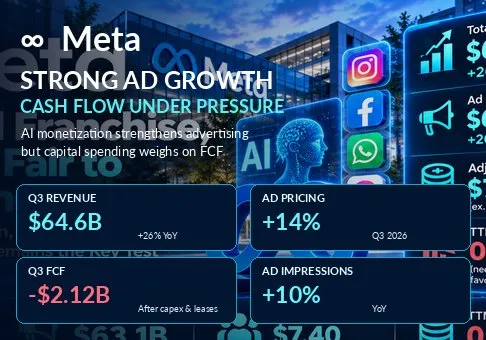
Advertising monetization is working. Revenue growth is supported by both delivery volume and realized ad pricing, rather than user growth alone. The implication is that the core franchise merits confidence, while new model businesses should remain optionality until their economics are disclosed.
-
The headline profit comparison is misleading. The quarter combines a large litigation charge with an unusually weak prior-year tax comparison. Company-disclosed EPS excluding the current legal charge is USD 7.40, versus GAAP USD 3.83. Neither the headline EPS growth rate nor a simple adjustment captures future settlement cash payments.
-
The apparent earnings discount has a cash-flow qualification. USD 624.52 divided by four times USD 7.40 equals 21.1x adjusted quarterly run-rate earnings. This is a research calculation, not forward consensus: it annualizes a single quarter, retains normal share-based compensation, ignores seasonality and predates financing dilution. It offers a reasonable franchise valuation, but insufficient evidence of a large margin of safety.
-
Financing is now part of the investment thesis. The upsized USD 25.0 billion common offering is linked to forward settlement, while the USD 12.5 billion preferred issue has a 6.50% dividend rate. The proposed ATM is a separate future program. Access to capital reduces funding stress, but existing shareholders bear an explicit cost before new projects demonstrate returns.
-
Cash recovery can change the conclusion. Using Q3 diluted weighted-average shares of 2.573 billion gives a valuation proxy of USD 1,606.9 billion; this is not exact current market capitalization. Annualizing nine-month FCF produces USD 14.732 billion and only a 0.92% proxy cash yield. A sustained recovery above a 3% FCF yield would require roughly USD 48.2 billion annually at that denominator, before dilution. That is the operational hurdle behind a more favorable view.
Price reference is the October 29, 2026 regular-session Nasdaq close, independently cross-checked. Financial information runs through the September quarter and subsequent financing announcements available at the October 30 research cutoff. No analyst consensus or external target price is assumed. The USD 7.40 adjustment removes only the identified charge; calling it fully normalized earnings would be too generous.
A useful valuation stress test holds that earnings run rate constant. At illustrative multiples of 18x, 21x and 24x, values would be USD 532.80, USD 621.60 and USD 710.40, respectively: approximately −14.7%, −0.5% and +13.8% versus the reference close. These are mechanical sensitivities, not price targets or forecasts. The downside case requires no collapse in advertising, only a lower valuation for weaker cash conversion. Conversely, a premium multiple requires better investment returns, not merely a larger capital budget.
2. Company Overview, Business Mix, and Core Operating Metrics
Meta Platforms, Inc. earns most of its money by connecting advertisers with people using its social and messaging products. Consumers generally supply attention, engagement and signals rather than a subscription payment for the core experience. Advertisers compete in auctions, and campaign allocation responds to conversion performance, measurement quality and business conditions. There is no broad multiyear contracted advertising backlog comparable with a cloud infrastructure order book.
Family of Apps includes Facebook, Instagram, Messenger, WhatsApp and other services. Its recommendation and advertising systems benefit from scale, but the financial disclosure does not provide separate app-level income statements. Adding estimated Instagram profits to reported Family of Apps profit would double count. Reality Labs sells immersive hardware and related software/content; it remains a substantial investment burden with a different product cycle and cost structure.
|
Business / Q3 2026
|
Revenue, USD bn
|
Operating income, USD bn
|
Economic model and constraint
|
|
Family of Apps: advertising
|
63.061
|
Included in FoA
|
Auction-based marketing on Facebook, Instagram and related surfaces; impressions and advertiser returns drive spending.
|
|
Family of Apps: other
|
1.097
|
Included in FoA
|
Business messaging, subscriptions and other services; small relative to advertising.
|
|
Family of Apps: total
|
64.158
|
17.117
|
99.3% of revenue; includes legal and AI costs. Individual app profitability is not disclosed.
|
|
Reality Labs
|
0.443
|
−4.129
|
Hardware, software and immersive experiences; current losses absorb app-generated resources.
|
|
Consolidated
|
64.601
|
12.988
|
FoA rows are nested, not additive; GAAP operating margin 20.1%, calculated.
|
Revenue amounts are nested: advertising plus other revenue equals FoA, and FoA plus Reality Labs equals consolidated revenue. Operating income follows the reported segment allocation, including legal costs. The data do not support a separate profitable AI software segment or a standalone margin for Muse.
Core operating metrics and changes
|
Operating metric
|
Q3 2026 / latest
|
Comparison / meaning
|
|
DAP, billion
|
3.64
|
3% YoY; measures people across apps, not additive app user counts.
|
|
Ad impressions growth
|
10%
|
Quantity expansion; not necessarily the same as user growth.
|
|
Average ad price growth
|
14%
|
Auction mix and performance; not a contractual price increase.
|
|
Advertising revenue growth, calculated
|
25.9%
|
63.061 / 50.082 − 1; consistent with rounded volume-price bridge.
|
|
Legal-charge-adjusted operating margin, calculated
|
35.4%
|
(12.988 + 9.890) / 64.601; GAAP margin remains 20.1%.
|
|
Q4 revenue outlook, USD bn
|
73–76
|
Management forecast; not analyst consensus.
|
|
2026 capex outlook, USD bn
|
135–145
|
Includes finance lease principal; prior range 130–145.
|
|
Common financing / preferred gross size, USD bn
|
25.0 / 12.5
|
Pricing supersedes initial 22.5 common size; separate proposed ATM up to 60.
|
The quantity-price bridge is informative: 1.10 multiplied by 1.14 minus one equals 25.4%, close to the reported advertising increase after rounding and mix. Since DAP increased more slowly, the monetization improvement depends on engagement, inventory, targeting and advertiser willingness to pay. Average ad price is a blended outcome; it does not isolate AI productivity from geographic, format or industry mix.
The direction of evidence favors successful reinvestment in the advertising product. However, core recommendation improvements and frontier model development have different payback periods. A model launch does not establish subscription demand, external enterprise revenue or profitable inference. The base case therefore gives primary credit to existing app monetization and requires independent proof before capitalizing a large new AI earnings stream.
The candidate screen preceded selection: METAON/USDT, AMDON/USDT and AAPLON/USDT each displayed populated LBank spot interfaces with chart and trading controls, and official notices established underlying-company mappings. Meta was last covered July 30, 92 days earlier; AMD and Apple were covered inside the 90-day window. Meta also had a recent earnings release and a more recent financing event. Interface access confirms the research universe, not executable liquidity. Token quotes are excluded from the equity valuation, and token exposure does not itself confer direct ownership of Nasdaq shares.
3. Fundamental Quality
|
Financial metric, USD bn except EPS
|
9M 2025
|
9M 2026
|
Q3 2025
|
Q3 2026
|
|
Revenue
|
141.073
|
181.712
|
51.242
|
64.601
|
|
GAAP operating income
|
58.531
|
54.635
|
20.535
|
12.988
|
|
GAAP net income
|
37.690
|
52.481
|
2.709
|
9.860
|
|
GAAP diluted EPS, USD
|
14.62
|
20.44
|
1.05
|
3.83
|
|
Operating cash flow
|
79.586
|
96.873
|
29.999
|
32.786
|
|
Cash purchases of property and equipment
|
48.308
|
83.055
|
18.829
|
33.942
|
|
Finance lease principal
|
1.770
|
2.769
|
0.545
|
0.964
|
|
FCF, calculated using company definition
|
29.508
|
11.049
|
10.625
|
−2.120
|
|
Share-based compensation
|
14.537
|
21.053
|
5.555
|
7.363
|
|
Cash and marketable securities, year-end / latest
|
81.592
|
82.449
|
Not a Q3 comparison
|
Not a Q3 comparison
|
|
Long-term debt carrying value, year-end / latest
|
58.744
|
80.922
|
Not a Q3 comparison
|
Not a Q3 comparison
|
The final two rows compare December 31, 2025 with September 30, 2026, despite appearing beneath the nine-month headings; they are balance-sheet snapshots, not period flows. FCF equals operating cash flow less cash property/equipment purchases and finance lease principal. All other financial rows use their stated periods. GAAP figures are retained unless explicitly described as charge-adjusted.
Growth quality is strong; incremental cash conversion is weak. Advertising is producing substantial revenue growth, but nine-month FCF has contracted despite rising operating cash flow. Capital purchases and lease principal absorb the difference. Depreciation will continue to recognize existing investment over time, so current accounting margins can look healthier than contemporaneous owner cash generation. Useful-life assumptions and the time between equipment delivery and revenue generation matter to future earnings quality.
Share-based compensation also deserves an economic charge. It is added back in operating cash flow, but transfers value to employees unless repurchases offset issuance. Reported cash repurchases were zero in the first nine months, while basic weighted-average shares increased in the quarter. A cash-flow improvement that relies mainly on more equity compensation would not justify the same per-share valuation as an improvement from advertiser returns.
The balance sheet has liquidity, but less surplus flexibility. Cash and marketable securities are close to the carrying value of long-term debt. This simple comparison excludes lease liabilities, restricted cash, legal payments and other obligations; it is not a complete net-debt calculation. The 10-Q separately discloses USD 355.73 billion of leases not yet commenced and USD 454.52 billion of non-cancelable commitments, including USD 121.41 billion due in 2027. These are different contractual categories and maturities, not amounts to add mechanically to current debt or this year's capex.
The investment implication is reduced flexibility if ad growth slows. Contractual cloud purchases can affect operating costs, infrastructure acquisitions can affect capex, and leases can affect several cash-flow lines. They cannot all be classified as additional capital expenditure without a reconciliation. The exposure is economically meaningful even though treating the full nominal total as immediately payable debt would exaggerate near-term stress.
Reproducible operating-to-valuation bridge
Start with Q3 advertising revenue of USD 63.061 billion. An illustrative next-year comparable quarter with impressions up 8% and ad pricing up 8% would produce 63.061 × 1.08 × 1.08 = USD 73.554 billion, an increase of USD 10.493 billion. These are analyst assumptions, not guidance. At a 35% incremental operating margin and a 17% tax rate, incremental after-tax operating earnings would be approximately USD 3.048 billion for that quarter.
Holding other items unchanged, matching that performance across four quarters would imply USD 12.193 billion of incremental annual after-tax operating earnings. If annual investment cash outlays also rise by an assumed USD 10 billion, only about USD 2.193 billion remains as incremental cash before working-capital changes, depreciation adjustments and financing effects. This is a simplified marginal bridge, not a full FCF forecast; it demonstrates why faster revenue growth need not create an equally large increase in distributable cash.
A separate funding sensitivity is more immediate. Nine-month operating cash flow annualized is USD 129.164 billion. Against the USD 140 billion midpoint of capex guidance, that implies negative USD 10.836 billion of FCF before other investing and financing uses. Seasonality makes this unsuitable as a full-year forecast. Nevertheless, remaining Q4 capex implied by the annual range is USD 49.176–59.176 billion after nine-month expenditure of USD 85.824 billion. Q4 operating cash flow must exceed that range merely to produce positive quarterly company-defined FCF.
Capital allocation and dilution
The priced common deal references 40 million shares, or 46 million with the full option, at USD 625. Meta initially receives no proceeds from the borrowed shares sold by the forward counterparties; settlement is expected on or before November 19, 2027. Therefore the announced gross common offering cannot simply be added to September cash as already received funding. Expected closing on October 29 does not resolve that proceeds-timing distinction.
The preferred principal implies USD 0.8125 billion of annual dividends at 6.50%, assuming the base issue and excluding options. Dividends may be paid in cash or permitted shares, creating either a cash burden or more dilution. On the initial Class A conversion terms, the depositary shares imply 17.025–20.0 million common-equivalent shares. Together with the 40 million common forward, the base share addition would be approximately 2.22–2.33% of Q3 diluted shares before options, future ATM issuance and capital-structure adjustments. This is an illustrative eventual dilution comparison, not a forecast of GAAP diluted shares.
The January 2027 Class C distribution changes the share structure and quoted per-share units. A one-for-one distribution by itself creates no business value and does not represent the same economic dilution as selling new shares for capital. All conversion and price comparisons must be adjusted consistently once the new class is issued. The proposed USD 60 billion ATM remains capacity under discussion rather than completed proceeds or an assured issuance schedule.
The single most important variable is incremental post-investment cash flow per fully diluted share. Advertising growth, capex, preferred distributions and shares issued must be assessed jointly. The present base case assigns stronger quality to the operating franchise than to the shareholder cash return profile.
4. Industry and Competitive Landscape
The relevant market is digital performance advertising and consumer attention, with AI infrastructure supplying a critical input. Search captures explicit intent, social discovery creates demand and product awareness, and commerce-linked advertising competes near the transaction. These categories overlap in advertiser budgets but are not identical markets. Growth comparisons are evidence of commercial momentum, not a measured change in market share.
|
Competitive arena
|
Observable evidence
|
Winner / pressure point
|
Valuation implication
|
|
Social discovery and performance advertising
|
Meta Q3 advertising 63.061; impressions +10%, price +14%.
|
Meta wins incremental monetization; no independently verified market-share percentage.
|
Strong distribution warrants a premium only if incremental compute produces cash returns.
|
|
Search and online video
|
Google Q3 advertising 82.012; YouTube ads 11.207.
|
Google remains larger in advertising; YouTube competes with Reels for budgets and attention.
|
Meta is a beneficiary, not the sole beneficiary of AI-enabled advertising.
|
|
Visual shopping and smaller social platforms
|
Pinterest Q2 users 640 million; Snap Q2 revenue 1.599.
|
Pinterest grows; Snap profitability remains pressured despite improved revenue.
|
Smaller rivals can win niches but lack Meta scale; size alone does not establish share losses.
|
|
Compute, models and capital provision
|
Meta plans large infrastructure commitments and equity-linked funding.
|
Hardware/cloud suppliers gain contracted demand; platform shareholders fund the buildout.
|
Part of advertising productivity is transferred to infrastructure providers and new capital.
|
|
Company / period
|
Relevant revenue, USD bn
|
YoY growth
|
Profitability / KPI and comparability
|
|
Meta Platforms, Inc. / Q3 2026
|
63.061 advertising
|
25.9%
|
Group GAAP operating margin 20.1%; charge-adjusted 35.4%. Advertising margin unavailable.
|
|
Alphabet Inc. / Q3 2026
|
82.012 Google advertising
|
10.6%
|
Google Services operating margin 40.7%; includes subscriptions/devices and excludes some shared AI costs.
|
|
Pinterest, Inc. / Q2 2026
|
1.180 total
|
18%
|
GAAP net loss 0.047; adjusted EBITDA 0.311; MAUs 640 million. Earlier quarter.
|
|
Snap Inc. / Q2 2026
|
1.599 total
|
19%
|
GAAP net loss 0.164; adjusted EBITDA 0.250; FCF 0.121. Earlier quarter.
|
Comparisons are approximate in scope and period: Meta and Alphabet report September quarters; Pinterest and Snap figures are June-quarter disclosures. Total revenue is used for the smaller peers and includes non-advertising activities. Adjusted EBITDA excludes expenses that GAAP includes and must not be ranked directly against Meta's operating margin. Google Services also benefits from a different allocation of shared AI research. No synchronized peer P/E ranking is asserted without a consistently dated price and earnings basis.
Meta is winning on monetization momentum; Google remains a larger advertising platform; Pinterest is growing in a focused shopping niche; Snap remains the weakest of these disclosed GAAP profit profiles. This is a statement about observed economics, not a claim that Snap or Pinterest lost users or market share to Meta. Google's lower advertising growth on a larger base does not establish competitive decline.
AI can improve campaign targeting and creative production across several platforms simultaneously. In that environment, advertisers may retain part of the efficiency benefit and infrastructure suppliers may capture another part through higher compute demand. Meta's distribution advantage helps it monetize improvements, but does not guarantee that each successive model investment has the same return as earlier recommendation spending.
The research conclusion is therefore twofold: Meta is a net beneficiary at the operating level, while external suppliers and new capital providers can absorb a meaningful portion of the economic surplus. The stock should be valued on the residual available to each existing share. A strong advertising quarter can coexist with a less attractive shareholder funding equation.
5. Key Risks
-
Advertiser return deteriorates. If realized ad pricing falls to low-single-digit growth while delivery growth slows, revenue can decelerate sharply because the drivers multiply. Fixed infrastructure and model costs then reduce incremental margin and the earnings multiple that investors will support.
-
Investment cash outlays exceed internal generation. If 2027 spending rises faster than operating cash flow, the company may need more financing. New shares, preferred dividends or debt service reduce per-share cash returns even if reported revenue continues to grow.
-
Legal charges convert into cash payments or wider restrictions. Settlement accruals do not eliminate the economic cost. Additional youth-related or privacy actions could increase payments, restrict targeting or change product engagement, affecting both cash and ad pricing. The existing charge is excluded for operating analysis, not forgiven for valuation.
-
AI capacity produces a lower return than expected. Underutilization, shorter hardware economic lives or rapid model commoditization could reduce revenue per unit of compute. Impairments or higher depreciation would then pressure future earnings after cash has already been spent.
-
Financing dilution exceeds the illustrative base case. Full options, additional compensation, a larger conversion share count or ATM sales at lower prices would increase dilution. A rising total earnings pool could still produce disappointing earnings per existing share.
-
Product and platform rules change. Reduced access to conversion signals, weaker youth engagement, or a shift toward lower-monetizing formats can lower advertiser returns. Data restrictions can hurt both delivery efficiency and the price advertisers are willing to pay.
-
Governance sustains low-return spending. The non-voting class preserves financing flexibility without proportionately broadening voting influence. If management continues projects with weak payback, minority holders may face a persistent valuation discount despite a healthy core business.
6. Monitoring Checklist
-
Advertising driver pair: Combined impression and pricing growth above 20%, with neither turning negative, would support the franchise thesis. Pricing below 5% would weaken confidence even if impressions remain strong. These are research thresholds.
-
Q4 sales execution: Revenue below USD 73 billion would miss the bottom of company guidance; above USD 76 billion would strengthen demand evidence. Revenue alone is insufficient without a corresponding margin and cash bridge.
-
Cash investment coverage: Compare Q4 operating cash flow with implied remaining capex of USD 49.176–59.176 billion. Sustained coverage above 1.0x would improve the funding view; continued deficits would reinforce caution.
-
Legal-charge-adjusted operating margin: Sustaining approximately 35% or higher would support underlying profitability. A decline below 30% without an identifiable temporary item would challenge the assumption of strong core economics.
-
2027 resource budget: Track capex guidance, third-party cloud expense, lease commencements and commitment conversion together. Operating cash flow growing faster than their combined cash burden would support a more positive view.
-
Funding and fully diluted ownership: Confirm preferred closing, common forward settlement, options and the proposed ATM separately. Reconcile proceeds, preferred distributions and share counts; do not treat all announced financing as immediate cash.
-
Class C and Reality Labs: Verify the January 19, 2027 charter effective date, subsequent record/payment dates and adjusted token treatment. Reality Labs loss near USD 15 billion in 2027, as management expects, would release resources only if AI spending does not absorb the full saving.
The base case becomes more constructive when recurring FCF, after lease principal and the economic cost of equity compensation, grows faster than the diluted share base. A temporary working-capital inflow or a new financing round would not meet that test.
7. Sources
All sources were revisited on October 30, 2026. Company statements and SEC filings establish financial facts; scenario assumptions and calculations above are LBank Research estimates. Market prices are secondary-source snapshots. Financing closing, final options and the proposed ATM are not represented as completed transactions without confirmation. Current peer trading multiples and an independently verified digital-ad market-share dataset were not obtained; neither is fabricated.
-
Meta Reports Third Quarter 2026 Results (https://investor.atmeta.com/investor-news/press-release-details/2026/Meta-Reports-Third-Quarter-2026-Results/default.aspx) — October 21, 2026; quarter ended September 30; earnings, guidance and legal-charge reconciliation.
-
Meta Platforms, Inc. Form 10-Q (https://www.sec.gov/Archives/edgar/data/1326801/000162828026066773/meta-20260930.htm) — Filed October 22, accepted October 21; financial statements, MD&A, commitments and risk factors.
-
-
-
-
Alphabet Announces Third Quarter 2026 Results (https://www.sec.gov/Archives/edgar/data/1652044/000165204426000080/googexhibit991q32026.htm) — October 28; September quarter; Google advertising and Google Services; shared AI costs partly outside segment.
-
-
-
Meta Platforms Stock Price History (https://stockanalysis.com/stocks/meta/history/) — Secondary market data; October 29 regular-session Nasdaq close USD 624.52; not token pricing.
-
-
METAON/USDT Spot Trading | LBank (https://www.lbank.com/trade/metaon_usdt) — Opened October 30 by web reader and direct HTTP; populated quote, turnover, chart and buy/sell controls. Quotes differ by retrieval/cache and are excluded from valuation.
-
-
AMDON/USDT Spot Trading | LBank (https://www.lbank.com/trade/amdon_usdt) — Opened October 30; populated interface; excluded from selection because covered August 5.
-
-
AAPLON/USDT Spot Trading | LBank (https://www.lbank.com/trade/aaplon_usdt) — Opened October 30; populated interface; excluded because underlying Apple covered September 16.
-



 Transfer