Author: LBank Research Analyst: Ludo
Disclaimer: This report is compiled and analyzed from publicly available information and is intended solely for information sharing and research discussion. It does not constitute investment advice, a securities recommendation, a trading instruction, or any guarantee of returns. The company operations, valuations, market prices, and consensus expectations discussed herein may change over time. Readers should independently verify the data and make their own decisions. The displayed LBank quote refers to the tokenized spot pair and should not be treated as the Nasdaq closing price of the underlying common stock.
1. Core Conclusion
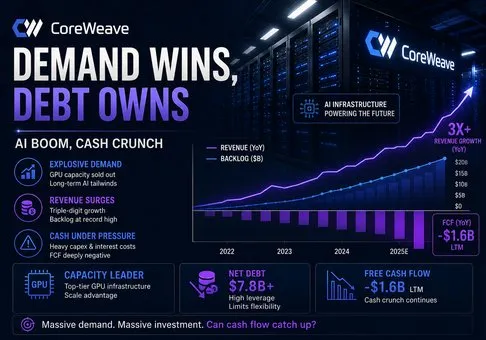
Overall judgment: CoreWeave is the clearest publicly traded expression of surging AI-compute demand, but the equity remains unattractive on a risk-adjusted basis because extraordinary backlog growth is being purchased with negative free cash flow, heavy refinancing dependence, and interest expense that already exceeds adjusted operating profit; the decisive variable is whether adjusted operating margin can rise faster than debt service before GPU capacity becomes less scarce.
-
Demand is exceptional and contractually visible. Second-quarter revenue rose 112% year over year to USD 2.575 billion, active power reached 1.5 GW, and unsatisfied remaining performance obligations reached USD 103.7 billion. Forty-one percent of that RPO is expected to be recognized by June 2028, while more than USD 25 billion of additional customer commitments signed in early Q3 was not included. This is stronger evidence than a generic AI narrative: customers are reserving capacity years in advance.
-
Operating leverage has begun, but it has not reached the capital providers. Adjusted operating income improved from USD 21 million in Q1 to USD 128 million in Q2, lifting adjusted operating margin from 1% to 5%. Yet Q2 net interest expense was USD 640 million, five times adjusted operating income, and the GAAP net loss was USD 626 million. The business can show a 59% adjusted EBITDA margin while still destroying equity earnings because depreciation and financing are core economic costs, not peripheral adjustments.
-
Cash flow is positive only before the infrastructure bill. First-half operating cash flow was USD 3.663 billion, helped by USD 1.365 billion of deferred-revenue inflows and favorable receivables movement. Cash purchases of property and equipment were USD 14.117 billion, producing mechanically calculated free cash flow of negative USD 10.454 billion. Financing activities supplied USD 13.985 billion. The practical conclusion is that customers validate demand, but creditors and new shareholders fund delivery.
-
The valuation does not compensate for the balance-sheet structure. Using 551 million June-quarter shares and the latest available underlying-market reference near USD 86.25 produces an illustrative equity value of about USD 47.5 billion. Adding approximately USD 35.1 billion of recourse and non-recourse debt and subtracting USD 5.5 billion of cash gives an enterprise value near USD 77 billion, or roughly 6.0 times the midpoint of updated 2026 revenue guidance of USD 12.4 billion to USD 13.2 billion. That multiple is not extreme for 100%-plus growth, but it is demanding for a company whose 2026 capital-expenditure guidance of USD 35 billion to USD 39 billion is about three times annual revenue.
-
The stock can outperform only if margin expansion outruns financing pressure. A sustained adjusted operating margin above 15%, annualized run-rate revenue near USD 19.5 billion, and a decline in interest expense as a percentage of revenue would invalidate the cautious view. The thesis weakens further if adjusted operating margin stays below 10% while annual cash capital expenditure remains above operating cash flow by more than USD 15 billion. CoreWeave is winning demand today, but debt currently owns too much of the economics.
2. Company Overview, Business Mix, and Core Operating Metrics
CoreWeave operates a purpose-built cloud platform for artificial-intelligence training, inference, reinforcement learning, and other accelerated-computing workloads. Its customers include AI laboratories, hyperscalers, software companies, financial institutions, and large enterprises. The company acquires GPUs, networking equipment, storage, power, and data-center capacity; combines them with scheduling and software tools; and sells committed or on-demand access to computing capacity. Revenue is therefore recognized as infrastructure becomes available and customers consume contracted services, not when a backlog contract is signed.
The commercial model sits between a hyperscale public cloud and a specialized infrastructure lessor. Long-duration commitments provide revenue visibility and help finance dedicated assets, while flexible capacity and spot offerings improve utilization. CoreWeave Interconnect, SUNK, LOTA, ARENA, Weights & Biases, ARIA, and Sandboxes add a software and orchestration layer. That layer matters because pure GPU rental should converge toward infrastructure-like returns as supply expands; differentiated scheduling, developer tooling, and inference performance are the most credible route to durable pricing power.
|
Business layer
|
Customer need
|
Q2 evidence
|
Economic character
|
Research judgment
|
|
AI compute
|
Large GPU clusters for training and production inference
|
1.5 GW active power and 3.7 GW contracted power
|
High revenue visibility, extreme upfront capital intensity
|
The scale advantage is real, but returns depend on utilization and funding cost
|
|
Committed cloud
|
Reserved capacity for AI labs and hyperscalers
|
USD 103.7 billion RPO plus over USD 25 billion of early-Q3 commitments
|
Long duration with delivery and service obligations
|
Backlog reduces demand risk while increasing execution and concentration risk
|
|
Flexible and spot capacity
|
Variable workloads and shorter enterprise commitments
|
Flex Reservations, Spot, and Dedicated Inference
|
Potentially better utilization and pricing, but more cyclical
|
Important bridge from a few mega-contracts to a broader customer base
|
|
Software and tools
|
Scheduling, model development, observability, and cross-cloud access
|
Weights & Biases, SUNK, ARIA, Sandboxes, and LOTA
|
Lower incremental capital intensity if monetized separately
|
The most valuable strategic layer, but financial contribution is not separately disclosed
|
CoreWeave has diversified from a single dominant customer, but concentration remains high. The Q2 10-Q shows Customer A at 36% of quarterly revenue, Customer B at 26%, and Customer C at 10%. The top three therefore represented 72% of revenue. This is better than the 71% contribution from one customer in Q2 2025, but it is not diversified in the way a conventional public cloud is diversified. A large contract can transform backlog quickly; a delayed data-center handoff or customer budget revision can also move quarterly revenue and utilization materially.
Core Operating Metrics and Changes
|
Metric or event
|
Q2 2026
|
Q2 2025
|
Change
|
Investment meaning
|
|
Revenue
|
2,575
|
1,212
|
112%
|
Capacity delivery is converting contracted demand into reported revenue
|
|
Adjusted operating income
|
128
|
200
|
-36%
|
Sequential improvement is meaningful, but year-over-year economics remain weaker
|
|
Adjusted operating margin
|
5%
|
16%
|
-11 pts
|
The platform has not recovered prior-period adjusted operating efficiency
|
|
Net interest expense
|
640
|
267
|
140%
|
Financing cost is rising faster than revenue and dominates the equity income statement
|
|
Net loss
|
-626
|
-290
|
116%
|
Depreciation and interest prevent adjusted EBITDA from reaching common shareholders
|
|
Revenue backlog
|
103,700
|
30,100
|
245%
|
Demand visibility is the strongest part of the thesis, subject to delivery conditions
|
Amounts are USD millions except percentages and percentage-point changes. Backlog is not GAAP revenue and includes committed amounts subject to service availability and delivery. The main change in the quarter was not merely revenue growth; it was the combination of nearly 500 MW of active-power additions, sequential adjusted operating margin expansion, and another increase in committed demand. That combination supports a rapid second-half revenue ramp.
The market should not confuse a backlog increase with immediate economic value. Forty-one percent of RPO is expected within 24 months, 39% in months 25 through 48, and the remainder in months 49 through 78. Assets must be procured before much of that revenue can be recognized. As a result, backlog growth pulls capital expenditure and financing forward while revenue and cash earnings arrive later.
3. Fundamental Quality
|
Metric
|
Q2 2025
|
Q1 2026
|
Q2 2026
|
H1 2026
|
Quality assessment
|
|
Revenue
|
1,212
|
2,078
|
2,575
|
4,653
|
Exceptional growth and improving delivery scale
|
|
GAAP operating income
|
19
|
-144
|
-49
|
-193
|
Still negative after economically essential depreciation
|
|
Adjusted EBITDA
|
753
|
1,157
|
1,510
|
2,667
|
Strong pre-depreciation earnings, but not a proxy for distributable cash
|
|
Net interest expense
|
267
|
536
|
640
|
1,176
|
The clearest constraint on equity earnings
|
|
Operating cash flow
|
N/A
|
N/A
|
N/A
|
3,663
|
Improved materially, partly through deferred revenue and working capital
|
|
Cash capital expenditure
|
N/A
|
N/A
|
N/A
|
14,117
|
Infrastructure spending overwhelms operating cash generation
|
|
Free cash flow
|
N/A
|
N/A
|
N/A
|
-10,454
|
Negative by operating cash flow less cash purchases of property and equipment
|
Amounts are USD millions. Free cash flow is calculated as operating cash flow of USD 3.663 billion minus USD 14.117 billion of cash purchases of property and equipment. This conservative definition excludes another USD 9.796 billion of unpaid or OEM-financed equipment additions, so cash capital expenditure understates the full infrastructure added during the period.
Growth and margins. Revenue growth is high quality in the narrow sense that it is supported by deployed power, recognized revenue, deferred revenue, and contracted obligations. It is lower quality in the shareholder-return sense because each incremental unit of revenue requires a large installed asset base. Property and equipment rose to USD 46.7 billion at June 30 from USD 30.6 billion at year-end.
Depreciation and amortization on property and equipment was USD 2.5 billion in the first half, showing why adjusted EBITDA overstates economic profitability.
Cash flow and capital expenditure. Operating cash flow turned positive, but the conversion is partially contractual financing from customers. Deferred revenue increased by USD 1.365 billion in the first half, and accounts receivable released USD 607 million. Those are helpful sources of funding, yet they carry future service obligations. CoreWeave then issued USD 16.747 billion of debt, repaid USD 5.219 billion, and raised USD 2.982 billion through private placements. The company is successfully financing growth; it has not made growth self-funding.
Balance sheet and capital allocation. Recourse debt totaled about USD 31.4 billion and non-recourse debt about USD 3.7 billion at June 30, versus USD 5.5 billion of cash. Operating lease liabilities added another USD 16.3 billion. Non-recourse financing protects the parent from some project-specific claims, but creditors still have priority over project cash flows. June issuance included senior notes carrying coupons as high as 9.625% and 8.500% in euros. Capital is available, but it is not cheap.
Fundamental conclusion. CoreWeave has strong demand quality and weak equity cash quality. The single most important variable is adjusted operating income after depreciation relative to net interest expense. Until that ratio approaches one, growth primarily validates customers and lenders rather than common-share economics.
4. Industry and Competitive Landscape
AI cloud infrastructure spans GPU procurement, data-center construction, power, high-speed networking, storage, orchestration, and developer software. CoreWeave competes with AWS, Azure, Google Cloud, and Oracle Cloud, as well as specialized providers such as Nebius, IREN, Lambda, and Crusoe. Hyperscalers have lower funding costs and broader enterprise distribution. Specialists can optimize clusters faster, accept concentrated workloads, and move more aggressively into new GPU generations.
|
Competitive dimension
|
CoreWeave position
|
Main alternatives
|
Economic implication
|
|
GPU and systems access
|
Deep NVIDIA relationship and first Vera Rubin NVL72 bring-up
|
Hyperscalers, Oracle, Nebius, and other NVIDIA cloud partners
|
Early access supports bookings but accelerates obsolescence risk for older fleets
|
|
Power and deployment
|
1.5 GW active and 3.7 GW contracted at Q2
|
Hyperscaler campuses and power-rich data-center operators
|
Power is a moat only when capacity arrives on time and stays utilized
|
|
Customer contracts
|
USD 103.7 billion RPO with large AI-lab and hyperscaler commitments
|
Customer self-build and multi-cloud procurement
|
Visibility is exceptional, but 72% top-three concentration limits bargaining resilience
|
|
Software differentiation
|
SUNK, W&B, ARIA, Sandboxes, LOTA, and cross-cloud interconnect
|
Managed AI stacks from AWS, Azure, Google, and Oracle
|
Software is the route to durable margins; no separate economics are disclosed
|
|
Cost of capital
|
Large asset-backed, unsecured, convertible, and equity financing program
|
Investment-grade hyperscaler balance sheets
|
CoreWeave must earn a higher infrastructure return to offset materially higher funding cost
|
|
Company
|
Latest comparable indicator
|
Growth and margin signal
|
Capital position
|
Competitive conclusion
|
|
CoreWeave
|
Q2 revenue USD 2.575 billion; RPO USD 103.7 billion
|
Revenue up 112%; adjusted operating margin 5%
|
H1 cash capex USD 14.1 billion; gross debt about USD 35.1 billion
|
Demand and backlog leader among specialists; weakest cash conversion
|
|
Nebius
|
Q1 AI-cloud revenue about USD 390 million
|
Cloud revenue up 841% from a small base; cloud adjusted EBITDA margin about 45%
|
Earlier-stage capacity build with strategic customer prepayments
|
Faster percentage growth but far smaller delivery scale
|
|
Oracle
|
Latest disclosed quarterly IaaS revenue about USD 4.9 billion
|
IaaS growth 84% in the cited period
|
Broader software cash flows and lower-risk enterprise distribution
|
Strongest specialized hyperscaler threat because it can bundle databases and applications
|
|
AWS
|
Q1 2026 revenue USD 37.7 billion
|
Revenue up 28% with far greater scale
|
Funded by Amazon operating cash flow and investment-grade access
|
Scale and cost-of-capital winner; slower because its denominator is much larger
|
Peer periods and definitions differ and are used as directional operating comparisons. CoreWeave is winning the specialized AI-cloud demand contest because it combines new-generation hardware, rapid deployment, and willingness to finance very large dedicated clusters. AWS and Oracle win on funding durability. Nebius offers a purer early-stage alternative but lacks CoreWeave's scale.
The likely industry winner is not the provider with the largest backlog alone; it is the provider that converts contracted power into high utilization without allowing depreciation, interest, and customer concentration to absorb the economics. CoreWeave is currently a net winner in revenue share and a net loser in cash-funded resilience. A future supply surplus would expose that asymmetry quickly because hyperscalers can cut price and continue investing through a downturn.
5. Key Risks
-
Customer concentration converts a demand success into a counterparty risk. Three customers represented 72% of Q2 revenue. If one delays deployment, shifts workloads to self-built infrastructure, or renegotiates pricing, utilization and revenue could fall before the associated debt and depreciation decline.
-
Financing cost can prevent operating leverage from reaching shareholders. Q2 net interest expense of USD 640 million exceeded adjusted operating income by USD 512 million. If interest expense remains above 20% of revenue, even strong adjusted EBITDA will not support positive net income.
-
GPU obsolescence can shorten asset lives. CoreWeave's rapid adoption of Blackwell and Rubin strengthens performance but may reduce the residual value of older equipment. Shorter useful lives would raise depreciation and impairments and undermine adjusted EBITDA-based valuation.
-
Backlog is conditional, not cash in the bank. RPO depends on service availability, delivery, and estimates of variable consideration. The economic value can be lower than the headline amount if capacity is late, service credits rise, or customers receive resale rights.
-
Hyperscalers can compete with cheaper capital. AWS, Azure, Google, and Oracle can fund AI infrastructure from broader cash-generating businesses. If specialized GPU scarcity eases, CoreWeave may need to lower price or accept shorter contracts while retaining a higher funding cost.
-
Dilution and governance remain material. Private placements added shares at USD 87.20 and USD 109.00 in the first half, convertible financing can create future dilution, and Class B shares carry ten votes each. Common shareholders finance growth while founders retain concentrated voting control.
-
Financial-control weaknesses raise reporting risk. The Q2 10-Q states that material weaknesses in IT controls, segregation of duties, and finance staffing continued at June 30. Failure to remediate them before required 2026 internal-control reporting could reduce confidence and increase compliance cost.
6. Monitoring Checklist
-
Adjusted operating margin: above 15% would show that scale and pricing are overcoming depreciation; below 10% through year-end would reinforce the cautious thesis.
-
Interest burden: net interest expense below 15% of revenue would be constructive; a level above 20% would show that lenders still capture most incremental economics.
-
Free cash flow gap: monitor operating cash flow less cash property purchases. A deficit narrower than USD 5 billion per half would be progress; another deficit above USD 10 billion would imply continued financing dependence.
-
RPO conversion: compare recognized revenue with the 41% of RPO expected by June 2028. Slower conversion without lower capex would signal delivery or utilization problems.
-
Customer concentration: a top-three revenue share below 60% would strengthen durability; a return above 75% would increase renegotiation and counterparty risk.
-
Active power and utilization: power growth must translate into revenue faster than depreciation. Active-power additions without sequential margin expansion would be negative.
-
Capital cost: track new coupons, refinancing spreads, cash interest, and the split between recourse and non-recourse debt. Lower spreads matter more than headline financing volume.
-
Insider sales and dilution: several Rule 10b5-1 plans can begin from late August or September 2026. New equity, convertibles, or large insider sales would expand supply and weaken per-share participation.
7. Sources