Author: LBank Research Analyst: Ludo
Trading Pair: CSCOUSDT([CSCOUSDT Contract Trading | LBank Futures](https://www.lbank.com/futures/cscousdt/))
Disclaimer: This report is compiled and analyzed from publicly available information and is intended solely for information sharing and research discussion. It does not constitute investment advice, a securities recommendation, a trading instruction, or any guarantee of returns. The company operations, valuations, market prices, and consensus expectations discussed herein may change over time. Readers should independently verify the data and make their own decisions.
1. Core Conclusion: AI Networking Is Accelerating, but 33x Earnings Leaves Little Margin for Execution
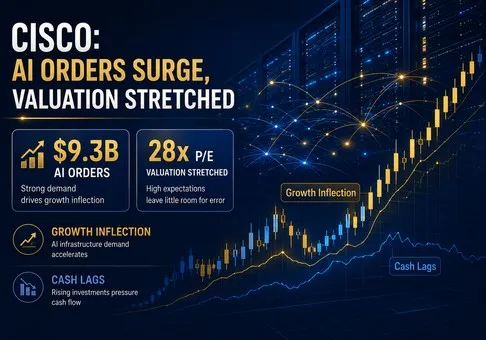
Overall view: Cisco is again a high-quality growth company rather than merely a mature networking cash generator. A genuine networking refresh and hyperscaler AI ramp lifted FY2026 revenue by 12% and GAAP operating income by 31%. The stock nevertheless offers a slightly unfavorable risk-reward at the August 17 close of $112.90: approximately 33.9x FY2026 GAAP EPS, 28.0x the midpoint of FY2027 GAAP EPS guidance, and a 2.9% FY2026 free cash flow yield already discount successful order conversion. The decisive variable is whether 35% product-order growth converts into durable revenue without product gross margin or cash conversion deteriorating.
1. The growth inflection is broad and operationally credible. Q4 revenue reached $17.252B, up 18% year over year, while product orders increased 35%, or 25% excluding hyperscalers. Networking orders grew 40% and remained in double digits for an eighth consecutive quarter. This is stronger evidence than one quarter of shipment revenue: enterprise, webscale, geography, and product demand are advancing together, which supports Cisco's FY2027 revenue guide of $72.2B-$73.4B.
2. AI has moved from narrative to a measurable revenue bridge. Hyperscaler AI infrastructure orders totaled $9.3B in FY2026 and recognized revenue was approximately $4B; Cisco expects approximately $7.5B of FY2027 AI infrastructure revenue. The $3.5B increase alone equals 5.5% of FY2026 group revenue. At Cisco's 63.2% FY2026 product gross margin, it could add about $2.21B of gross profit before incremental expenses. AI is therefore large enough to influence group earnings, not merely the valuation story.
3. Reported profitability improved faster than revenue, but cash flow did not. FY2026 GAAP operating margin expanded about 3.5 percentage points to 24.3%, GAAP net income rose 30% to $13.267B, and GAAP EPS increased 31% to $3.33. Operating cash flow, however, was flat at $14.2B while capital expenditure rose 56% to $1.410B. Simplified free cash flow fell about 3.8% to $12.783B, so the income statement is currently stronger than cash conversion.
4. The stock's post-earnings decline corrected exuberance but did not create a clear valuation discount. Cisco closed at $123.88 before the release and $113.47 the next day, an 8.4% decline; by August 17 it closed at $112.90. Using approximately 3.941B shares outstanding produces a market capitalization near $445B. That equals about 7.0x FY2026 revenue, 33.9x GAAP earnings, and a 2.9% free cash flow yield. The FY2027 GAAP EPS midpoint of $4.03 lowers the multiple to 28.0x, but that still requires double-digit growth and stable margins.
5. Cisco's advantage is portfolio breadth; its weakness is that pure-play competitors monetize the fastest pool more efficiently. Arista's Q2 revenue grew 37.7% with a 45.4% GAAP operating margin, materially above Cisco's 24.7% Q4 margin. Cisco counters with campus, routing, security, observability, services, and a much larger installed base. The thesis weakens if product orders fall below 15% growth, AI revenue tracks below $7B in FY2027, or product gross margin drops below 61%; it strengthens if order growth remains above 20% while free cash flow again exceeds net income.
2. Company Overview, Business Mix, and Core Operating Metrics: The Installed Base Is Becoming an AI Distribution Channel
Cisco sells the hardware, software, subscriptions, and support required to connect and protect enterprise and cloud infrastructure. Networking remains the economic center: switches, routers, wireless systems, silicon, optics, and management software serve campuses, data centers, service providers, and hyperscalers. Products are sold directly and through a broad channel, while software subscriptions and support contracts extend revenue beyond the initial equipment sale.
Security combines network, cloud, identity, and threat-detection capabilities. The Splunk acquisition expanded Cisco from network telemetry into security analytics and observability, but security's FY2026 growth of only 2% shows that integration breadth has not yet translated into peer-leading organic growth. Collaboration includes Webex, calling, contact-center, and endpoint products. Observability includes Splunk and application-performance tools; it remains small under Cisco's product taxonomy because services and subscriptions also appear outside the product categories.
Services comprise maintenance, technical support, advisory work, and recurring obligations attached to Cisco's installed base. FY2026 services revenue was flat, yet its 68.8% gross margin exceeded the 63.2% product gross margin and stabilized consolidated economics. The installed base matters strategically: every campus refresh or AI-fabric win creates future software, support, security, and observability opportunities. The risk is that customers increasingly separate those purchases and select best-of-breed vendors.
| FY2026 business |
Products, customers, and model |
Revenue |
YoY |
Share of group revenue |
Key economics / KPI |
Research judgment |
| Networking |
Switching, routing, wireless, silicon, optics, and management for enterprise, cloud, and service providers |
$34.668B |
0.22 |
54.70% |
Q4 orders +40%; AI revenue about $4B for FY2026 |
The principal growth and profit engine; AI and campus refresh reinforce each other |
| Security |
Network, cloud, identity, and threat security, including Splunk-linked capabilities |
$8.232B |
0.02 |
13.00% |
Q4 revenue +14% |
Q4 improved, but annual growth still trails security pure plays |
| Collaboration |
Webex, calling, contact center, and devices |
$4.300B |
0.04 |
6.80% |
Q4 revenue +12% |
Improving, but not a primary valuation driver |
| Observability |
Splunk-led monitoring, analytics, and application visibility products |
$1.095B |
0.04 |
1.70% |
Q4 revenue +6% |
Strategic cross-sell value exceeds the small product-revenue line |
| Services |
Support, maintenance, advisory, and recurring services across the installed base |
$15.030B |
Flat |
23.70% |
FY2026 gross margin about 68.8% |
Stable margin anchor, but no longer a group growth contributor |
| Group |
Secure networking platform plus lifecycle services |
$63.325B |
0.12 |
100% |
FY2026 GAAP operating margin 24.3% |
Quality improved materially, led by product mix and operating leverage |
Note: Revenue shares are calculated from company-reported FY2026 category revenue and may not sum precisely because of rounding. Product category revenue is not identical to recurring-revenue or end-market disclosure.
Core Operating Metrics and Changes
The August 12 release matters because it closed FY2026 with revenue and earnings above the prior high end of company guidance while establishing a much higher FY2027 base. Q4 revenue of $17.252B exceeded the prior $16.7B-$16.9B guide; non-GAAP EPS of $1.22 exceeded the prior $1.16-$1.18 range. More important, management moved from approximately $4B of FY2026 AI revenue to approximately $7.5B expected for FY2027.
|
Metric / event
|
Latest value
|
Comparison
|
Basis
|
Investment meaning
|
|
Q4 FY2026 revenue
|
$17.252B
|
+18% YoY; above prior guide
|
GAAP
|
Product shipment growth confirms that earlier orders are converting
|
|
Product orders
|
+35% YoY
|
+25% excluding hyperscalers
|
Company order metric
|
Demand is broader than one AI customer group, reducing concentration risk at the order level
|
|
AI infrastructure
|
$9.3B FY2026 orders; about $4B revenue
|
FY2027 revenue expected at about $7.5B
|
Hyperscaler-focused company disclosure
|
The expected $3.5B revenue increase equals 5.5% of the FY2026 group base
|
|
Q4 margins and EPS
|
64.1% GAAP gross margin; 24.7% GAAP operating margin; $0.97 GAAP EPS
|
Operating margin +3.7 points; EPS +52% YoY
|
GAAP
|
Expense growth remained below revenue growth, creating real leverage
|
|
FY2026 cash flow
|
$14.193B operating cash flow; $12.783B simplified FCF
|
OCF flat; FCF -3.8% YoY
|
FCF = OCF less $1.410B capex
|
Earnings growth has not yet translated into higher owner cash flow
|
|
FY2027 guidance
|
Revenue $72.2B-$73.4B; GAAP EPS $4.00-$4.06
|
Midpoints imply +15.0% revenue and +21.0% GAAP EPS
|
Company guidance
|
Guidance supports growth status, but the current multiple already assumes execution
|
|
Market reaction
|
$123.88 on Aug. 12 to $113.47 on Aug. 13
|
-8.4%; $112.90 by Aug. 17
|
Nasdaq closes
|
The decline reflects prior expectations, not weak reported fundamentals
|
Note: Simplified free cash flow is operating cash flow minus acquisitions of property and equipment. The price reaction is descriptive and does not establish a single cause.
The operating bridge is favorable but not effortless. If FY2027 AI revenue rises by $3.5B and earns the FY2026 product gross margin of approximately 63.2%, incremental gross profit would be about $2.21B. Assuming 40% of that gross profit is absorbed by incremental operating expense leaves roughly $1.33B of operating income; applying the 14.5% tax rate embedded in FY2027 guidance yields about $1.14B of net income, or roughly $0.29 per share on 3.95B shares. This illustrative bridge represents about 41% of the $0.70 increase between FY2026 GAAP EPS and the FY2027 guidance midpoint. The remainder must come from non-AI networking growth, mix, restructuring, and operating leverage.
That calculation also reveals the valuation risk. At 28.0x FY2027 guided GAAP EPS, the illustrative AI increment accounts for about $8 per share of value at the same multiple. A $1B shortfall in AI revenue would reduce EPS by only about $0.08 under the same assumptions, but a shortfall accompanied by lower product gross margin or weaker enterprise orders would challenge the multiple applied to the entire earnings base.
3. Fundamental Quality: Earnings Have Inflected Before Cash Conversion
|
Item
|
FY2024
|
FY2025
|
FY2026
|
Latest change
|
Research judgment
|
|
Revenue
|
$53.803B
|
$56.654B
|
$63.325B
|
+11.8%
|
Growth accelerated as Splunk, networking refresh, and AI converged
|
|
GAAP gross margin
|
64.7%
|
64.9%
|
64.5%
|
-0.4 points
|
Strong and stable, though faster product growth dilutes the services mix
|
|
GAAP operating margin
|
22.6%
|
20.8%
|
24.3%
|
+3.5 points
|
Splunk integration and expense discipline produced meaningful leverage
|
|
GAAP net income / EPS
|
$10.320B / $2.54
|
$10.180B / $2.55
|
$13.267B / $3.33
|
Net income +30.3%
|
Earnings quality improved, though other income also helped FY2026
|
|
Operating cash flow
|
$10.880B
|
$14.193B
|
$14.193B
|
Flat
|
Working-capital conversion did not match reported profit growth
|
|
Simplified free cash flow
|
$10.210B
|
$13.288B
|
$12.783B
|
-3.8%
|
Adequate but not supportive of the earnings acceleration narrative
|
|
Capital expenditure
|
$0.670B
|
$0.905B
|
$1.410B
|
+55.8%
|
Still only 2.2% of revenue, but rising faster than sales
|
|
Cash and investments / debt
|
$17.854B / at least $20.109B
|
$16.110B / $28.093B
|
$15.918B / $29.533B
|
Net debt about $13.6B
|
Manageable leverage, but the Splunk-era balance sheet is no longer net-cash rich
|
Note: FY2024 and FY2025 audited figures come from Cisco's 10-K filings; FY2026 figures are unaudited release data pending the FY2026 10-K. FY2024 debt shown is current and non-current long-term debt and may exclude other short-term borrowings; FY2025-FY2026 debt uses the balance-sheet short-term and long-term debt lines. Simplified FCF is operating cash flow less property-and-equipment purchases.
Growth and margins. FY2026 revenue exceeded the prior peak by a wide margin, while the 24.3% GAAP operating margin recovered above FY2024 despite Splunk amortization and restructuring costs. Product revenue increased 16%, and networking grew 22%; services were flat. This mix normally pressures consolidated gross margin, yet the decline was only about 40 basis points. That resilience indicates pricing and product economics remain healthy.
Cash flow and capital expenditure. FY2026 net income exceeded operating cash flow by about $0.9B, versus operating cash flow exceeding net income by about $4.0B in FY2025. Share-based compensation was $3.830B, equal to 28.9% of GAAP net income, and simplified FCF fell even before deducting stock compensation. Cisco still generates substantial cash, but investors should not treat the 31% EPS growth as equivalent to owner-cash growth.
Balance sheet and capital allocation. Cash and investments of $15.918B covered only about 54% of $29.533B of short- and long-term debt. The balance sheet remains investment grade in economic quality because recurring revenue and annual cash generation are substantial, but acquisition-funded debt reduces flexibility. Cisco returned $3.2B through dividends and repurchases in Q4, including buybacks at an average $111.53, close to the August 17 market price. Repurchases near fair value are neutral rather than a major source of per-share value.
Fundamental conclusion. Cisco's fundamental quality is strong and improving, but the single most important variable is order-to-cash conversion. Sustained product orders above 20% with FY2027 free cash flow growth above net-income growth would validate the premium multiple. Continued flat cash flow would show that accounting earnings and working-capital demands are diverging.
4. Industry and Competitive Landscape: Cisco Is Winning the Refresh, While Arista Still Sets the Efficiency Standard
The relevant industry is broader than Ethernet switching. It spans data-center fabrics, campus switching and wireless, routing, security, observability, support, silicon, and optical connectivity. AI training and inference increase east-west traffic, cluster size, bandwidth, and the cost of downtime. Enterprise campus refresh adds a separate cycle as customers move to higher-speed access, Wi-Fi 7, automation, and integrated security.
Public vendors do not disclose a uniform market-share denominator. Revenue mixes include hardware, software, acquisitions, and services, while order metrics differ across companies. The most defensible comparison is therefore operating scale, growth, margins, and disclosed demand rather than a fabricated precise share estimate.
| Competitive dimension |
Cisco's verifiable position |
Scale / scope limitation |
Main competitors |
Implication |
| AI and data-center fabrics |
$9.3B FY2026 hyperscaler AI orders; about $4B revenue |
Excludes broader enterprise AI and does not equal market share |
Arista, HPE/Juniper, merchant-silicon white boxes |
Cisco has become a credible AI winner, but Arista remains the pure-play benchmark |
| Campus and branch |
Q3 campus orders grew more than 25%; Q4 total networking orders +40% |
Cisco does not disclose campus revenue each quarter |
HPE Aruba, Juniper Mist, Extreme, Arista |
Installed base and channel favor Cisco during a refresh cycle |
| Security |
FY2026 product revenue $8.232B, +2%; Q4 +14% |
Category excludes some service and subscription economics |
Palo Alto Networks, Fortinet, CrowdStrike |
Portfolio breadth helps bundling, but organic growth lags specialists |
| Observability |
Splunk expands telemetry, analytics, and security reach |
Product category revenue understates broader Splunk contribution |
Datadog, Dynatrace, Palo Alto / Chronosphere |
Cross-sell is strategically valuable but integration economics remain hard to isolate |
| Profit model |
FY2026 GAAP operating margin 24.3%; services gross margin 68.8% |
Mix differs sharply from hardware-focused peers |
Arista, HPE, Extreme |
Services stabilize Cisco, but consolidated efficiency trails Arista |
| Company |
Latest comparable period |
Revenue / KPI |
Growth and profitability |
Operating and capital status |
Competitive conclusion |
| Cisco |
Q4 FY2026 / FY2026 ended Jul. 25 |
Q4 revenue $17.252B; FY revenue $63.325B; RPO $46.7B |
Q4 revenue +18%; GAAP operating margin 24.7%; product orders +35% |
AI revenue expected to rise from about $4B to $7.5B in FY2027 |
Net beneficiary: broad refresh and AI exposure outweigh slower services growth |
| Arista Networks |
Q2 2026 ended Jun. 30 |
Revenue $3.036B; Q3 guide about $3.3B |
Revenue +37.7%; GAAP operating margin 45.4% |
Introduced 1.6 Tbps AI fabric platforms; concentrated cloud and data-center exposure |
Efficiency winner: faster growth and far higher margin make it Cisco's strongest networking threat |
| HPE |
Q2 FY2026 ended Apr. 30 |
Networking revenue $2.690B |
Reported revenue +148.2% due mainly to Juniper; segment margin 21.6% |
Campus $1.322B; data center $320M; routing $775M; integration synergies underway |
Scale challenger: combined Aruba-Juniper breadth is real, but margin fell 3.4 points YoY |
| Palo Alto Networks |
Q3 FY2026 ended Apr. 30 |
Revenue $3.002B; NGS ARR $8.1B; RPO $18.4B |
Revenue +31%; GAAP operating loss $183M; adjusted FCF margin 38.5% |
CyberArk and Chronosphere added $388M of revenue and broadened platform scope |
Security growth winner: Cisco has distribution, but Palo Alto has superior disclosed security momentum |
Note: Periods and definitions are not fully comparable. HPE growth includes Juniper and its Networking segment; Palo Alto's reported growth and annualized recurring revenue include CyberArk and Chronosphere; Cisco and Arista order, RPO, and revenue definitions differ.
Arista is winning the high-performance pure-play economics. Its Q2 revenue growth was more than twice Cisco's Q4 growth rate, and its GAAP operating margin exceeded Cisco's by more than 20 percentage points. Cisco is nevertheless winning in absolute breadth: a customer can combine campus, data center, routing, security, observability, and support under one architecture and channel relationship. The two can both gain while AI networking expands, but Arista remains the greater threat to Cisco's premium data-center profit pool.
HPE is the most direct portfolio challenger after Juniper. Its reported 148% networking growth is acquisition-distorted, yet $2.690B of quarterly networking revenue and meaningful campus, routing, data-center, and security scale prevent Cisco from treating the enterprise refresh as uncontested. HPE's 21.6% segment margin, down from 25.0%, shows the cost of integration and mix; Cisco currently has better group-level earnings momentum.
In security, Palo Alto is the disclosed growth winner. Its Q3 revenue increased 31% and remaining performance obligation rose 36%, albeit with acquisition contribution. Cisco's 2% FY2026 security product growth is insufficient to claim share gains. Cisco is therefore a net beneficiary of AI networking and campus refresh, but not yet a proven net winner in security. The valuation should reflect that split rather than assign pure-play growth economics to every segment.
5. Key Risks
1. Order conversion and double-ordering risk. If product-order growth falls below 15% before revenue catches up, current demand may reflect capacity reservations or elongated lead times rather than durable consumption. Revenue growth would decelerate, inventory and working capital could rise, and the 28x forward GAAP multiple would likely contract.
2. AI customer concentration and architecture risk. The $9.3B FY2026 AI order pool is hyperscaler-focused. A delayed cluster, customer insourcing, custom silicon, white-box switching, or alternative fabric architecture that pushes FY2027 AI revenue below $7B would reduce growth and challenge Cisco's claim to a lasting AI share position.
3. Gross-margin compression. Faster product and hyperscaler revenue already shifts mix away from higher-margin services. Product gross margin below 61% or consolidated gross margin below 63% would signal price pressure, component costs, or unfavorable customer mix and would weaken the earnings leverage embedded in guidance.
4. Cash conversion and capital intensity. FY2026 simplified FCF fell despite 30% net-income growth. If FY2027 operating cash flow grows less than 10%, or capex rises above 3% of revenue, the free cash flow yield would remain below 3% and make the equity valuation harder to support.
5. Competitive share loss. Arista's 37.7% growth and 45.4% GAAP operating margin show that a focused competitor can reinvest while preserving superior economics. HPE/Juniper adds a second full-portfolio threat. Sustained peer growth more than 15 points above Cisco with declining Cisco product margins would imply share or mix erosion.
6. Security and Splunk integration risk. FY2026 security product revenue grew only 2%, while Palo Alto's platform metrics grew much faster, partly through acquisitions. If Cisco cannot accelerate security and observability organically, Splunk-related amortization, debt, and integration costs will have bought breadth without adequate return.
7. Balance-sheet and capital-allocation risk. Debt of $29.533B exceeds cash and investments by about $13.6B. Another large acquisition, buybacks materially above intrinsic value, or slower cash generation could delay deleveraging and reduce strategic flexibility.
8. Valuation risk. At 33.9x FY2026 GAAP EPS and about 7.0x revenue, Cisco is priced more like a durable compounder than its historical mature-networking profile. Even delivered guidance may not prevent multiple compression if the market lowers the terminal growth assumption.
6. Monitoring Checklist
- Product orders: growth above 20% would support a multi-quarter cycle; below 15% would weaken the demand thesis.
- AI infrastructure revenue: FY2027 progresses toward approximately $7.5B, with less than $7B indicating under-conversion and more than $8B strengthening share confidence.
- Networking growth: quarterly revenue growth above 15% would validate broad refresh demand; single digits would imply the order boom is fading.
- Product and consolidated gross margin: product above 62% and consolidated above 64% would confirm pricing discipline; product below 61% would weaken the earnings bridge.
- Free cash flow conversion: FY2027 simplified FCF at least equal to GAAP net income would repair the principal quality gap; another year below 90% conversion would weaken the view.
- RPO and deferred revenue: RPO growth above 7% and services RPO acceleration would show that recurring commitments are participating in the upcycle.
- Security and observability: combined organic acceleration into double digits would support the platform thesis; low-single-digit growth would confirm that specialists are winning.
- Peers: track Arista revenue growth and GAAP operating margin, HPE Networking growth and margin, and Palo Alto RPO growth. A persistent Arista growth advantage above 15 points or HPE margin recovery above 24% would increase competitive risk.
7. Sources