Author: LBank Research Analyst: Ludo
Trading Pair: BABAUSDT(https://www.lbank.com/trade/babaon_usdt)
Disclaimer: This report is compiled and analyzed from publicly available information and is intended solely for information sharing and research discussion. It does not constitute investment advice, a securities recommendation, a trading instruction, or any guarantee of returns. The company operations, valuations, market prices, and consensus expectations discussed herein may change over time. Readers should independently verify the data and make their own decisions.
1. Core Conclusion
Overall judgment: Alibaba is an exceptional Chinese commerce franchise with a genuinely accelerating AI cloud business, but the equity is only moderately attractive after the latest reset because AI applications and infrastructure are consuming more cash than cloud is yet producing; the decisive variable is whether AI Cloud and Compute Services can sustain growth above 35% while group capital expenditure stops rising faster than operating cash flow.
-
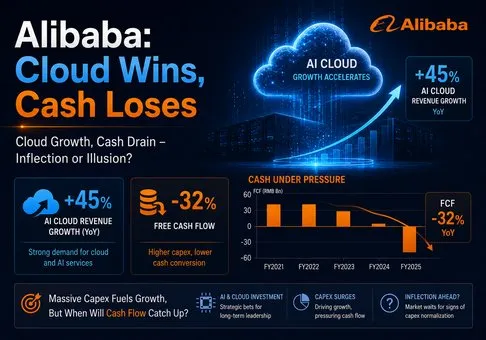
The cloud inflection is real and commercially meaningful. AI Cloud and Compute Services revenue rose 45% year over year to RMB48.4 billion in the June 2026 quarter, while segment adjusted EBITA increased 133% to RMB5.6 billion and margin expanded from 7.2% to 11.6%. AI-related product revenue reached RMB12.4 billion and delivered triple-digit growth for a twelfth consecutive quarter. This is no longer a model-demonstration story: cloud added RMB15.0 billion of quarterly revenue and RMB3.2 billion of adjusted EBITA year over year, a 21.4% incremental margin.
-
The group has not converted cloud success into better aggregate economics. Consolidated revenue increased 9%, yet adjusted EBITA fell 30% to RMB27.3 billion and GAAP operating margin compressed from 14% to 6%. The main bridge is visible: the RMB3.2 billion cloud EBITA improvement was overwhelmed by a RMB10.6 billion increase in AI Labs and Applications losses, while All Others swung from a small profit to a RMB3.3 billion loss. The investment case therefore depends on monetization beyond infrastructure, not merely faster compute demand.
-
Cash conversion is the central weakness. Operating cash flow rose 11% to RMB22.9 billion, but capital expenditure increased 75% to RMB67.7 billion, producing a RMB44.7 billion free-cash-flow outflow. On a mechanically updated trailing-twelve-month basis, operating cash flow was about RMB78.5 billion, capital expenditure about RMB155.1 billion, and company-defined free cash flow approximately negative RMB72.5 billion. The balance sheet can fund this phase, but the current earnings profile does not.
-
The HK 80 billion placement is strategically rational but economically costly for existing holders. Alibaba priced 710 million new ordinary shares at HK 112.70, equal to roughly 3.8% of the June-quarter basic weighted-average ordinary share count, and earmarked all net proceeds for full-stack AI. The proceeds equal only 1.18 quarters of June-quarter capital expenditure. Raising equity after repurchasing shares and while retaining substantial liquidity signals that management expects AI infrastructure needs to remain unusually heavy, it also transfers part of that execution risk to shareholders through dilution.
-
The valuation is not expensive on sales, but it is demanding on current cash earnings. At the August 21 ADR close of 119.34 and the June-quarter basic share count, mechanically calculated equity value was about 278.5 billion. After subtracting roughly 30.6 billion of net liquid investments, enterprise value was about 247.9 billion, or 1.6 times mechanically updated trailing revenue. However, it equated to roughly 26 times trailing adjusted EBITA and 40 times trailing non-GAAP net income, while trailing free cash flow was negative. A favorable view strengthens if cloud growth remains above 35%, cloud EBITA margin exceeds 15%, and quarterly capital expenditure falls below RMB55 billion; it weakens if cloud growth drops below 30% before AI application losses narrow materially.
The valuation calculations use the August 21, 2026 ADR close, the official June-quarter weighted-average share count, the June 30 balance sheet, and a mechanical trailing update that replaces the June 2025 quarter in fiscal-year 2026 results with the June 2026 quarter. They are observation tools rather than target prices.
2. Company Overview, Business Mix, and Core Operating Metrics: Commerce Funds the AI Stack, but the Funding Burden Is Rising
Alibaba Group is a global technology company centered on commerce and full-stack artificial intelligence. Its commerce platforms connect consumers and merchants through Taobao, Tmall, AliExpress, Lazada, Trendyol, wholesale marketplaces, grocery and on-demand delivery. It earns customer-management fees, commissions, direct-sales revenue, logistics and service revenue. The commerce ecosystem supplies traffic, merchant relationships, transaction data and cash generation.
AI Cloud and Compute Services combines Alibaba Cloud with T-Head Semiconductor. It sells public-cloud capacity, AI accelerator infrastructure, models, databases and orchestration software to enterprises and developers. The integration spans proprietary chips, heterogeneous compute clusters and the Qwen model ecosystem. Alibaba reported a 38.1% share of China's 2025 AI cloud market based on Omdia, but that estimate is a third-party market definition rather than a share of all Chinese cloud spending.
AI Labs and Applications contains the Qwen model labs, Qwen consumer application and QwenWork enterprise agent. It is strategically important because successful applications can create inference demand for Alibaba Cloud and feed real-world usage back into model development. Economically, it remains an incubation portfolio: June-quarter revenue was only RMB3.3 billion against a RMB13.9 billion adjusted EBITA loss, reflecting model investment and Qwen inference cost.
All Others includes Alibaba Health, digital media and entertainment, Amap, games and other technology businesses. It adds optionality but currently dilutes profitability. The new segment structure makes the central allocation choice clearer than before: mature commerce profit is funding both profitable cloud expansion and loss-making AI applications.
|
June 2026 quarter segment
|
Products and customers
|
Revenue
|
YoY
|
Share of consolidated revenue
|
Adjusted EBITA / margin
|
Research judgment
|
|
Alibaba E-commerce Group
|
Domestic and international marketplaces, direct sales, quick commerce, logistics and wholesale
|
RMB205.9bn
|
4%
|
76.5%
|
RMB39.7bn / 19.3%
|
Durable profit pool; weak China transaction activity is offset by quick-commerce scale and international efficiency
|
|
AI Cloud and Compute Services
|
Public cloud, AI compute, orchestration and T-Head chips for enterprises and developers
|
RMB48.4bn
|
45%
|
18.0%
|
RMB5.6bn / 11.6%
|
Best growth asset and the clearest source of incremental enterprise value
|
|
AI Labs and Applications
|
Qwen models, Qwen app and QwenWork
|
RMB3.3bn
|
16%
|
1.2%
|
Negative RMB13.9bn / negative 415%
|
Strategically coherent, but current inference and development economics destroy group profit
|
|
All Others
|
Health, entertainment, Amap, games and other technology assets
|
RMB28.8bn
|
1%
|
10.7%
|
Negative RMB3.3bn / negative 11.6%
|
Portfolio optionality remains a drag and carries impairment risk
|
|
Unallocated and eliminations
|
Corporate items and inter-segment transactions
|
Negative RMB17.5bn
|
N/M
|
Negative 6.5%
|
Negative RMB0.8bn
|
Required reconciliation; segment shares do not sum to 100% before eliminations
|
|
Consolidated
|
Commerce plus full-stack AI platform
|
RMB269.0bn
|
9%
|
100%
|
RMB27.3bn / 10.2%
|
Growth improved, but consolidated return on incremental investment deteriorated
|
The group's most valuable asset remains the commerce-to-cloud flywheel. Approximately 64 million 88VIP members represent a high-spending domestic customer base, while 250 million users had used AI shopping features through Qwen. Alibaba can distribute agents into shopping, merchant operations and DingTalk workflows without paying a third-party platform toll. That distribution advantage is difficult for a standalone model laboratory to replicate.
The constraint is that commerce itself is not accelerating. China E-commerce revenue fell 8%; customer-management revenue fell 7%, or grew only 1% excluding contra revenue from a new business-development program. China Quick Commerce grew 45% to RMB53.3 billion and improved unit economics, but high growth here partly reflects a more capital- and logistics-intensive revenue mix. International E-commerce fell 1%, although AliExpress reached operating profit. Commerce remains resilient, not reaccelerating.
Core Operating Metrics and Changes
The immediate trigger is the combination of Alibaba's August 20 June-quarter results and its August 23–24 equity-placement announcements. The results established the fastest cloud growth among the selected Chinese platform peers, while the placement revealed that management is unwilling to constrain infrastructure investment to internally generated near-term free cash flow.
|
Metric or event
|
Latest value
|
YoY / historical comparison
|
Accounting or statistical basis
|
Implication
|
|
Consolidated revenue
|
RMB269.0bn
|
Up 9%
|
U.S. GAAP company disclosure
|
Cloud and quick commerce more than offset weaker China marketplace and international commerce revenue
|
|
AI Cloud and Compute Services
|
RMB48.4bn revenue; RMB5.6bn adjusted EBITA
|
Revenue up 45%; adjusted EBITA up 133%
|
Recast segment; non-GAAP profit
|
A 21.4% incremental EBITA margin shows that infrastructure scale can be profitable
|
|
AI-related product revenue
|
RMB12.4bn
|
Triple-digit growth for 12 consecutive quarters
|
Company-defined product revenue
|
Demand is broad enough to support a multi-quarter cloud acceleration thesis
|
|
GAAP operating income
|
RMB15.2bn; 6% margin
|
Down 57%; margin down from 14%
|
U.S. GAAP
|
AI spending, a goodwill impairment and a European Commission fine provision overwhelmed revenue growth
|
|
Operating cash flow / free cash flow
|
RMB22.9bn / negative RMB44.7bn
|
Operating cash flow up 11%; FCF outflow worsened by RMB25.9bn
|
FCF equals operating cash flow less specified capital purchases and buyer-protection adjustments
|
Earnings quality is weak because the infrastructure build absorbs more than all operating cash generation
|
|
Capital expenditure
|
RMB67.7bn
|
Up 75% from RMB38.7bn
|
Company disclosure
|
The June-quarter run rate exceeds the new placement proceeds within five months
|
|
Liquid investments / debt-like obligations
|
RMB474.5bn / about RMB266.5bn
|
Liquid investments down RMB46.3bn sequentially
|
Debt-like obligations include bank borrowings, senior notes, convertible notes and exchangeable bonds
|
Net liquidity remains substantial, but debt and external equity are increasingly funding growth
|
|
Equity placement
|
HK 80bn; 710m new shares at HK 112.70
|
About 3.8% of basic weighted-average ordinary shares
|
Pending closing on August 26
|
Extends the AI investment runway but dilutes per-share participation and raises the proof threshold
|
The most important near-term earnings change is cloud's operating leverage. Revenue increased RMB15.0 billion and adjusted EBITA increased RMB3.2 billion, giving a reproducible 21.4% incremental margin. If the segment grew another 35% from the June-quarter base at a 20% incremental margin, it would add roughly RMB16.9 billion of quarterly revenue and RMB3.4 billion of adjusted EBITA. That would still cover less than one-third of the current RMB13.9 billion quarterly AI Labs loss. The application layer therefore must either monetize faster or reduce inference costs before cloud growth can lift consolidated earnings materially.
The placement also changes the capital-allocation message. Alibaba repurchased only 162 million ADSs in the June quarter, then raised approximately 10.2 billion equivalent through new shares. The transaction is large enough to support infrastructure expansion but small relative to a RMB67.7 billion quarterly capital-expenditure run rate. It is best read as evidence of management's confidence in demand and concern about funding intensity at the same time.
3. Fundamental Quality: The Balance Sheet Is Strong, but Free-Cash-Flow Quality Has Broken
|
Item
|
FY2024
|
FY2025
|
FY2026
|
June 2026 quarter / mechanically updated trailing period
|
Research judgment
|
|
Revenue
|
RMB941.2bn
|
RMB996.3bn
|
RMB1,023.7bn
|
RMB269.0bn quarter; RMB1,045.0bn trailing
|
Growth has reaccelerated, led by AI cloud and quick commerce
|
|
GAAP operating margin
|
N/A
|
14%
|
5%
|
6% in June quarter versus 14% prior year
|
Group operating leverage is negative despite faster revenue
|
|
Net income
|
RMB71.3bn
|
RMB126.0bn
|
RMB102.1bn
|
RMB10.4bn quarter; RMB70.2bn trailing
|
Investment gains, impairments and provisions make GAAP profit a weak proxy for operating power
|
|
Non-GAAP net income
|
RMB157.5bn
|
RMB158.1bn
|
RMB60.7bn
|
RMB20.7bn quarter; RMB47.9bn trailing
|
Core earnings have fallen much faster than revenue, weakening current valuation support
|
|
Operating cash flow
|
RMB182.6bn
|
RMB163.5bn
|
RMB76.2bn
|
RMB22.9bn quarter; RMB78.5bn trailing
|
Cash generation remains positive but is less than half the FY2024 level
|
|
Company-defined free cash flow
|
RMB156.2bn
|
RMB73.9bn
|
Negative RMB46.6bn
|
Negative RMB44.7bn quarter; negative RMB72.5bn trailing
|
The AI build has eliminated the former cash-return advantage
|
|
Capital expenditure
|
RMB32.1bn
|
RMB86.0bn
|
RMB126.1bn
|
RMB67.7bn quarter; RMB155.1bn trailing
|
Capital intensity is rising faster than revenue and internal cash generation
|
|
Liquid investments / debt-like obligations
|
N/A
|
N/A
|
RMB520.8bn liquid at March 2026
|
RMB474.5bn liquid / RMB266.5bn debt-like at June 2026
|
Net liquidity is strong, but the cushion is being consumed before the placement closes
|
Mechanically updated trailing figures equal fiscal-year 2026 results minus the June 2025 quarter plus the June 2026 quarter. Free cash flow follows Alibaba's non-GAAP definition. Debt-like obligations include current and non-current bank borrowings, senior notes, convertible senior notes and exchangeable bonds; lease liabilities are excluded.
Growth and margins. Revenue quality is mixed. Cloud growth is high-value because the segment is expanding margin while growing 45%. Quick-commerce growth is less valuable per revenue unit because fulfillment and subsidy intensity are structurally higher. The consolidated cost-of-revenue ratio rose from 55.1% to 61.8%, partly because of cloud and technology mix and partly because subsidies moved from marketing expense to contra revenue. This accounting presentation lowered reported marketing expense as a percentage of revenue and means the apparent sales-efficiency improvement should not be read in isolation.
Cash flow and capital expenditure. Cash conversion is weak by any practical measure. A business producing RMB22.9 billion of quarterly operating cash cannot indefinitely fund RMB67.7 billion of quarterly capital expenditure without drawing liquidity or issuing capital. The placement provides time, not proof of return. The positive point is that the company is buying assets tied to visible cloud demand rather than financing operating losses alone; the negative point is that AI Labs loss and infrastructure investment are occurring simultaneously.
Balance sheet and capital allocation. June liquid investments of RMB474.5 billion exceeded the approximately RMB266.5 billion debt-like obligations by about RMB208.0 billion, or $30.6 billion at the company's quarter-end translation rate. Adding the placement would replenish much of the quarter's liquidity decline. Yet issuing 3.8% more shares shortly after a period of buybacks makes the capital-return framework less credible. Investors should value the repurchase program only when repurchases exceed equity issuance and stock compensation over a full year.
Fundamental conclusion. Alibaba's asset quality is strong and its balance sheet remains investment-grade in substance, but its current financial quality is weak because consolidated profit and free cash flow are falling while revenue rises. The single most important variable is the ratio of trailing operating cash flow to capital expenditure: a recovery above 1.0 times would show that AI demand is funding itself; the mechanically updated ratio is only about 0.51 times.
4. Industry and Competitive Landscape: Alibaba Leads in Chinese AI Cloud Scale, While Tencent Leads in Cash-Funded AI Distribution
Alibaba competes across two overlapping industries. In commerce, it competes for consumer time, merchant budgets and fulfillment economics with JD.com, PDD Holdings, Meituan and short-video platforms. In AI infrastructure and applications, it competes with Tencent, Baidu, Huawei and other cloud and model providers for compute workloads, developers and enterprise deployments. No single revenue-share denominator captures both markets, so the most useful evidence is operating growth, segment scale, margin and capital intensity.
|
Competitive dimension
|
Alibaba's verifiable position
|
Share / scale basis and limitation
|
Principal competitors
|
Implication
|
|
China commerce demand
|
Approximately 64m 88VIP members; China E-commerce revenue down 8%
|
Membership is not GMV share; customer-management revenue was affected by contra revenue
|
JD, PDD, Meituan, Douyin commerce
|
Strong high-value customer base, but transaction momentum is not leading
|
|
AI cloud infrastructure
|
RMB48.4bn quarterly segment revenue, up 45%
|
Segment now includes T-Head; Omdia's 38.1% share refers to China's 2025 AI cloud market
|
Tencent Cloud, Baidu AI Cloud, Huawei Cloud
|
Alibaba is the scale and growth leader among publicly disclosed China AI cloud metrics
|
|
AI models and applications
|
Qwen family, QwenWork and 250m first AI-shopping experiences
|
Usage is cumulative and not equivalent to active paid users
|
Tencent Hy/WorkBuddy, Baidu DuMate, independent model labs
|
Distribution advantage is real; monetization is far behind inference cost
|
|
Proprietary compute
|
Zhenwu chip services used by more than 650 external customers across 20+ industries
|
Customer count does not disclose workload share or unit economics
|
Huawei Ascend, Baidu Kunlun, Tencent's heterogeneous procurement
|
Vertical integration can lower supply risk, but requires sustained capital and execution
|
|
Capital intensity
|
RMB67.7bn quarterly capex, up 75%; negative RMB44.7bn FCF
|
Procurement cycles can make quarterly comparisons volatile
|
Tencent RMB52.8bn capex; JD RMB5.5bn capex
|
Alibaba is spending at hyperscale without Tencent-like consolidated margin support
|
|
Company
|
Latest comparable period
|
Revenue or key operating metric
|
Growth / margin / cash flow
|
Operating and capital status
|
Competitive conclusion
|
|
Alibaba
|
June 2026 quarter
|
RMB269.0bn revenue; RMB48.4bn AI Cloud and Compute
|
Group revenue +9%; cloud +45%; adjusted EBITA margin 10%; FCF negative RMB44.7bn
|
RMB67.7bn capex; HK$80bn equity raise for AI
|
Cloud winner, but not yet a per-share cash-flow winner
|
|
Tencent
|
Q2 2026
|
RMB204.8bn revenue; RMB60.3bn FinTech and Business Services
|
Revenue +11%; non-IFRS operating margin 37%; FCF negative RMB13.8bn, or RMB37.6bn excluding compute prepayments
|
RMB52.8bn capex, +176%; RMB58.2bn net cash; continued buybacks
|
Best-funded AI distributor; stronger group economics than Alibaba
|
|
JD.com
|
Q2 2026
|
RMB346.4bn revenue; JD Retail operating income RMB13.5bn
|
Revenue -2.9%; JD Retail margin 4.6%; FCF RMB31.8bn
|
RMB5.5bn capex; repurchased 2.5% of shares in first half
|
Commerce efficiency winner, but weaker platform and AI-cloud optionality
|
|
Baidu
|
Q2 2026
|
RMB7.3bn AI Cloud Infra; RMB12.5bn core AI-powered business
|
AI Cloud +50%; group operating margin 10%; operating cash flow RMB3.4bn
|
RMB283.1bn cash and investments; legacy business declined 23%
|
Fast cloud challenger, but scale is far below Alibaba and legacy erosion is severe
|
Peer figures use the closest public operating metrics and are not fully comparable. Tencent does not separately disclose cloud revenue; its FinTech and Business Services segment includes payments. Baidu's AI Cloud Infra definition is narrower than Alibaba's AI Cloud and Compute Services. JD is primarily a first-party retail and logistics company, so its revenue is recorded on a more gross basis.
Alibaba is winning the Chinese AI cloud race on the combination of disclosed scale and growth. Baidu grew AI Cloud Infra slightly faster at 50%, but its RMB7.3 billion quarterly revenue was only about 15% of Alibaba's cloud-and-compute segment. Tencent has superior consumer distribution and much higher consolidated profitability, yet it does not provide a clean external cloud revenue figure. Alibaba therefore deserves the clearest cloud-platform premium among the group.
Tencent is winning the broader contest for self-funded AI adoption. Its non-IFRS operating margin was 37%, compared with Alibaba's 10% adjusted EBITA margin, and its negative free cash flow was largely explained by compute prepayments; excluding those prepayments, Tencent reported RMB37.6 billion of positive free cash flow. Alibaba's cash deficit instead reflects capital purchases that remain on the balance sheet plus application losses. JD is winning on disciplined commerce cash generation, while Baidu is losing the legacy-to-AI transition because 50% cloud growth has not offset a 23% decline in legacy business.
Alibaba is thus a net beneficiary of AI infrastructure demand but a temporary net loser in per-share cash economics. The cloud profit pool is migrating toward it; the shareholder return pool is migrating toward companies that can finance AI through current operating cash. Sustaining cloud growth while cutting AI application losses would reverse that second conclusion.
5. Key Risks
-
Cloud demand normalizes before the infrastructure base is absorbed. If AI Cloud and Compute growth falls below 30% while quarterly capital expenditure remains above RMB60 billion, depreciation and utilization pressure would slow segment margin expansion and make the placement look defensive rather than growth-accretive.
-
AI applications fail to monetize. AI Labs and Applications lost RMB13.9 billion of adjusted EBITA on RMB3.3 billion of revenue. If the loss remains above RMB10 billion for another two quarters without paid-user or enterprise-agent evidence, cloud profit growth will continue to be consumed at the application layer.
-
Commerce funds become less dependable. Like-for-like customer-management revenue grew only 1%, and China E-commerce revenue fell 8%. A decline in 88VIP members, weaker merchant spending or renewed subsidy competition could reduce the commerce EBITA that finances AI investment.
-
Equity issuance becomes recurrent. The current placement adds roughly 3.8% to the basic share base. Another comparable raise before operating cash flow covers capital expenditure would compound dilution and lower per-share upside even if enterprise value grows.
-
Chip supply and export controls disrupt the build. Alibaba is using both proprietary and heterogeneous third-party chips. Tighter access to advanced accelerators, networking components or manufacturing capacity could raise capital cost, reduce training efficiency and weaken Alibaba Cloud's pricing competitiveness.
-
Regulatory costs remain material. The June quarter included a EUR550 million provision related to a European Commission fine under the Digital Services Act. Further competition, data, platform or cross-border regulation could directly reduce operating income and limit ecosystem integration.
-
Segment reorganization obscures trend continuity. The new structure combines cloud with T-Head and reorganizes commerce and AI applications. Although prior-period figures were recast, changing internal allocations could make margin progress look better or worse without an equivalent economic change.
-
Investment gains distort earnings-based valuation. Trailing GAAP income includes volatile mark-to-market and disposal effects. If investors capitalize those gains as recurring profit, the apparent earnings multiple understates the valuation of the operating business.
6. Monitoring Checklist
-
AI Cloud and Compute revenue growth: Above 35% would reinforce platform leadership; below 30% would weaken the thesis before the new capacity earns an adequate return.
-
Cloud adjusted EBITA margin: Above 15% would show meaningful operating leverage; below 10% after the next two quarters would indicate that pricing or depreciation is absorbing scale benefits.
-
AI Labs and Applications adjusted EBITA loss: A decline below RMB10 billion per quarter would support improving unit economics; another quarter above RMB13 billion would undermine the application monetization case.
-
Quarterly capital expenditure: Below RMB55 billion would indicate procurement normalization; above RMB70 billion without faster cloud revenue would extend negative free cash flow.
-
Operating-cash-flow-to-capex ratio: Recovery above 0.8 times would be constructive, and above 1.0 times would validate self-funding; the mechanically updated trailing ratio is about 0.51 times.
-
China commerce health: Like-for-like customer-management growth above 5% and continued double-digit 88VIP growth would strengthen the funding base; contraction in both would weaken it.
-
Share count and capital returns: Net reduction in diluted shares over a twelve-month period would restore buyback credibility; further primary issuance before free-cash-flow recovery would be negative.
-
Peer signals: Track Tencent's compute spending and ex-prepayment free cash flow, Baidu AI Cloud Infra growth versus legacy decline, and JD Retail margin and FCF. Alibaba's relative case improves if it sustains superior cloud scale while narrowing the cash-conversion gap.
7. Sources